Maps
This Map Shows the Age of Every Building in Paris, France
France is known for its food, culture, and architecture. It is home to some of the oldest structures in the world. The Cairn of Barnenez is a Neolithic monument in northern Finistère, France. It dates back to 4800 BC. You can see the history of France through its many different architectural styles. When we think of old traditional French architecture, buildings like the Palace of Versailles and the Notre-Dame come to mind but, did you know the Louxor obelisk (even though it was a gift from Egypt) was built in 13 BC? The Les arènes de Lutèce, a Roman amphitheater that use to show gladiator fights, is dated in the 1st century. The Abbaye saint Germain des prés is 6th century. Many of the most famous buildings in France are located in the capital of Paris. You know of the Eiffel tower and the Louve, but there is also beautiful architecture all over the city neighborhoods. If you walk down any Paris street you see buildings that were built hundreds of years ago. This beautiful map of Paris shows the ages of livable dwellings throughout the city.
Click below to zoom

The color-coded geo map shows how old the buildings in Paris are, ranging from 2 years all the way up to 821 years old. You can see the oldest buildings are located in the center of the map and buildings outside of that tend to be newer. Imagine living in a building that is over 800 years old? The sights, the sounds, the ghost stories that must be a part habitation in such a historic location. The oldest buildings in the United States are only over 300 years old, a far cry from many of the buildings on this map.
Maps
Learn the Most Popular Couple Nickname in Every State
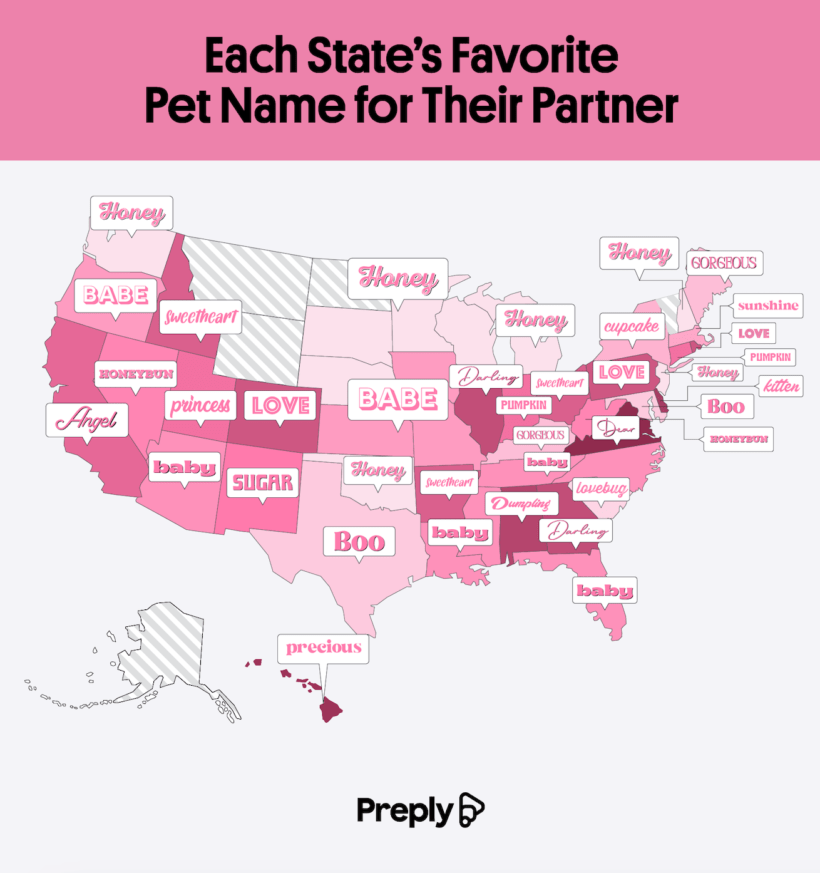
Preply’s new article on the most popular couple pet names in each state digs into one of life’s little joys: what couples call their partners. The piece also explores the importance couples place on these names. This is a crash course on love language, with “babe” and “honey” taking center stage, along with a surprising amount of “dumpling.”
The researchers surveyed thousands of U.S. residents nationwide and asked about their use of affectionate nicknames in relationships. They gave each state a score from 0 to 100 based on nickname frequency, variety, and whether folks saved their partner’s pet name on their phone instead of their given name. Basically, the more “boo” and the less “hey you,” the higher the score earned.
Click below to zoom.
Topping the nickname list with nearly perfect scores were New York (99.84), Virginia (98.30), and Nevada (98.04). If you’ve ever wondered which states are all over pet names like syrup on pancakes, here’s your answer. Virginians are particularly committed. They love nicknames so much that many people save them as contacts in their phones, and they will proudly defend their choice. Meanwhile, Nevadans use nicknames as flashy as the Las Vegas Strip.
On the other hand, some states are less than enthusiastic about nicknames. Minnesota holds the dubious honor of being the least likely to use a pet name and label the behavior as cringe. They’re followed by Colorado and Massachusetts. In Minnesota, you’re more likely to hear someone say “sweetheart” with more sarcasm than sweetness.
An extra fun section displays the team’s favorite unique couple nicknames and the state where they found them. While “babe,” “love,” and “honey” might be the most commonplace, some couples would rather put their own unique spin on relationship names.
- Honey is the most common pick in the country. This warm, golden classic is popular in Nebraska, Michigan, New Jersey, and Washington.
- Baby reigns as the most popular nickname in Florida, Arizona, and Tennessee, showing off a more playful vibe.
- Cupcake takes the cake for New York, where it seems to be a sweet and city-trendy name.
- Dumpling is Alabama’s favorite and seriously adorable nickname, while the sweet “sugar” is the most popular in New Mexico.
- In places like Nevada and West Virginia, some fun and old-fashioned nicknames are popular, like “honeybun.” Why settle for honey when you can add the buns?
These quirky, regional flavors of affection paint a sweet picture of romance in the U.S. Almost two-thirds of all couples surveyed are called “love,” “honey,” or “babe” by their partners, often more than by their actual names. Around 69% of Americans believe pet names strengthen their relationship and feel nervous or suspicious that something is wrong when their partner doesn’t use their nickname. Over a third of people admitted to using the same nickname across different relationships, indicating that these names come as natural old favorites more than specific choices to match certain personalities. This map is a fun look at the way Americans express love through names.
Charts
The Most Dangerous Places to Drive on New Year’s
Millions of Americans travel for New Year’s Eve and Day celebrations, but unfortunately, the last night of the year can be one of the most dangerous for drivers. CarInsurance.com analyzed data from the National Highway Traffic Safety Administration to find that certain states and counties have consistently higher fatality rates on December 31 and January 1. The team identified where and when the risks are highest.
Click below to zoom.
The team’s analysis examined NHTSA fatality numbers between 2014 and 2023, then adjusted this data relative to population to calculate the number of fatalities per 100,000 residents. They discovered that these states had the highest per-capita traffic deaths on New Year’s Eve:
- South Carolina – 1.39 deaths per 100,000 (71 total)
- Mississippi – 1.35 deaths per 100,000 (40 total)
- Louisiana – 1.33 deaths per 1000,000 (62 total)
Florida was also a high-risk location. Its deaths per capita rank fourth on the list, but the total number of New Year’s Eve fatalities are much higher than the top three states, with 270 deaths in total. This is largely due to Florida’s large population and number of dangerous counties.
Focusing on these high-risk counties revealed some especially hazardous locations. The deadliest U.S. counties on New Year’s Eve and Day were:
- Sarasota County, Florida – 2.3 fatalities per 100,000 (10 deaths)
- Manatee County, Florida – 2.0 per 100,000 (8 deaths)
- Davidson County, Tennessee – 1.96 per 100,000 (14 deaths)
Sarasota and Manatee counties are both linked to high rates of DUI-related traffic fatalities, which can help explain their placement at the top of the list.
The danger not only varies by place, but by the time of day. On New Year’s Eve, the deadliest hours occur between 2 a.m. and 3 a.m. for 38 recorded fatalities. On New Year’s Day, the early morning hours are by far the most dangerous, with 137 deaths occurring between 2 a.m. and 3 a.m. and 131 deaths between 1 a.m. and 2 a.m.
Over the decades, we see 1,047 deaths on December 31st and 1,474 on January 1st, so New Year’s Day has the most fatalities overall, which is probably due to partygoers under the influence returning home in the early morning hours.
The largest contributor to New Year’s traffic deaths is certainly alcohol impairment. For example, in 2022, 37% of deadly crashes on New Year’s Day involved an alcohol impaired driver. This number varies year-to-year, but it does highlight how common drunk driving is during holiday celebrations.
This pattern aligns with a broader national trend of alcohol-impaired driving leading to traffic fatalities. In 2023, a third of U.S. traffic deaths involved drunk drivers, prompting campaigns run during the holiday period with slogans like, “Drive sober or get pulled over.”
Understanding the safety facts the team outlined can help drivers make safe decisions over the holidays. We can see from the data that they should avoid driving between 1 a.m. and 3 a.m. on New Year’s Eve and New Year’s Day. They should arrange a sober ride and never drive under the influence. Always wear a seatbelt and be extra alert when driving.
Charts
The States Where Americans Give Hardware and Home Improvement Gifts
As the holidays approach, American families are thinking about gift-giving, and a trend stands out: Americans are giving home improvement and hardware items as useful and practical gifts. According to an Ace Hardware analysis of Bureau of Labor Statistics Consumer Expenditure Survey data spanning a decade of gift purchases, some regions are more likely to gift-wrap DIY tools, garden supplies, and appliances.
Click below to zoom.
Home ownership and upkeep are a major part of the American lifestyle. The team’s study found that 79% of homeowners undertake multiple home improvement projects each year, with many completing three or more. Americans spent $526 billion on home improvement in 2024. The number of projects per household has increased from 2.7 in 2015 to 3.4 in 2023. This commitment to home maintenance explains why hardware and home improvement supplies are a reliable gift choice, especially for people who live in older homes or in harsh climates.
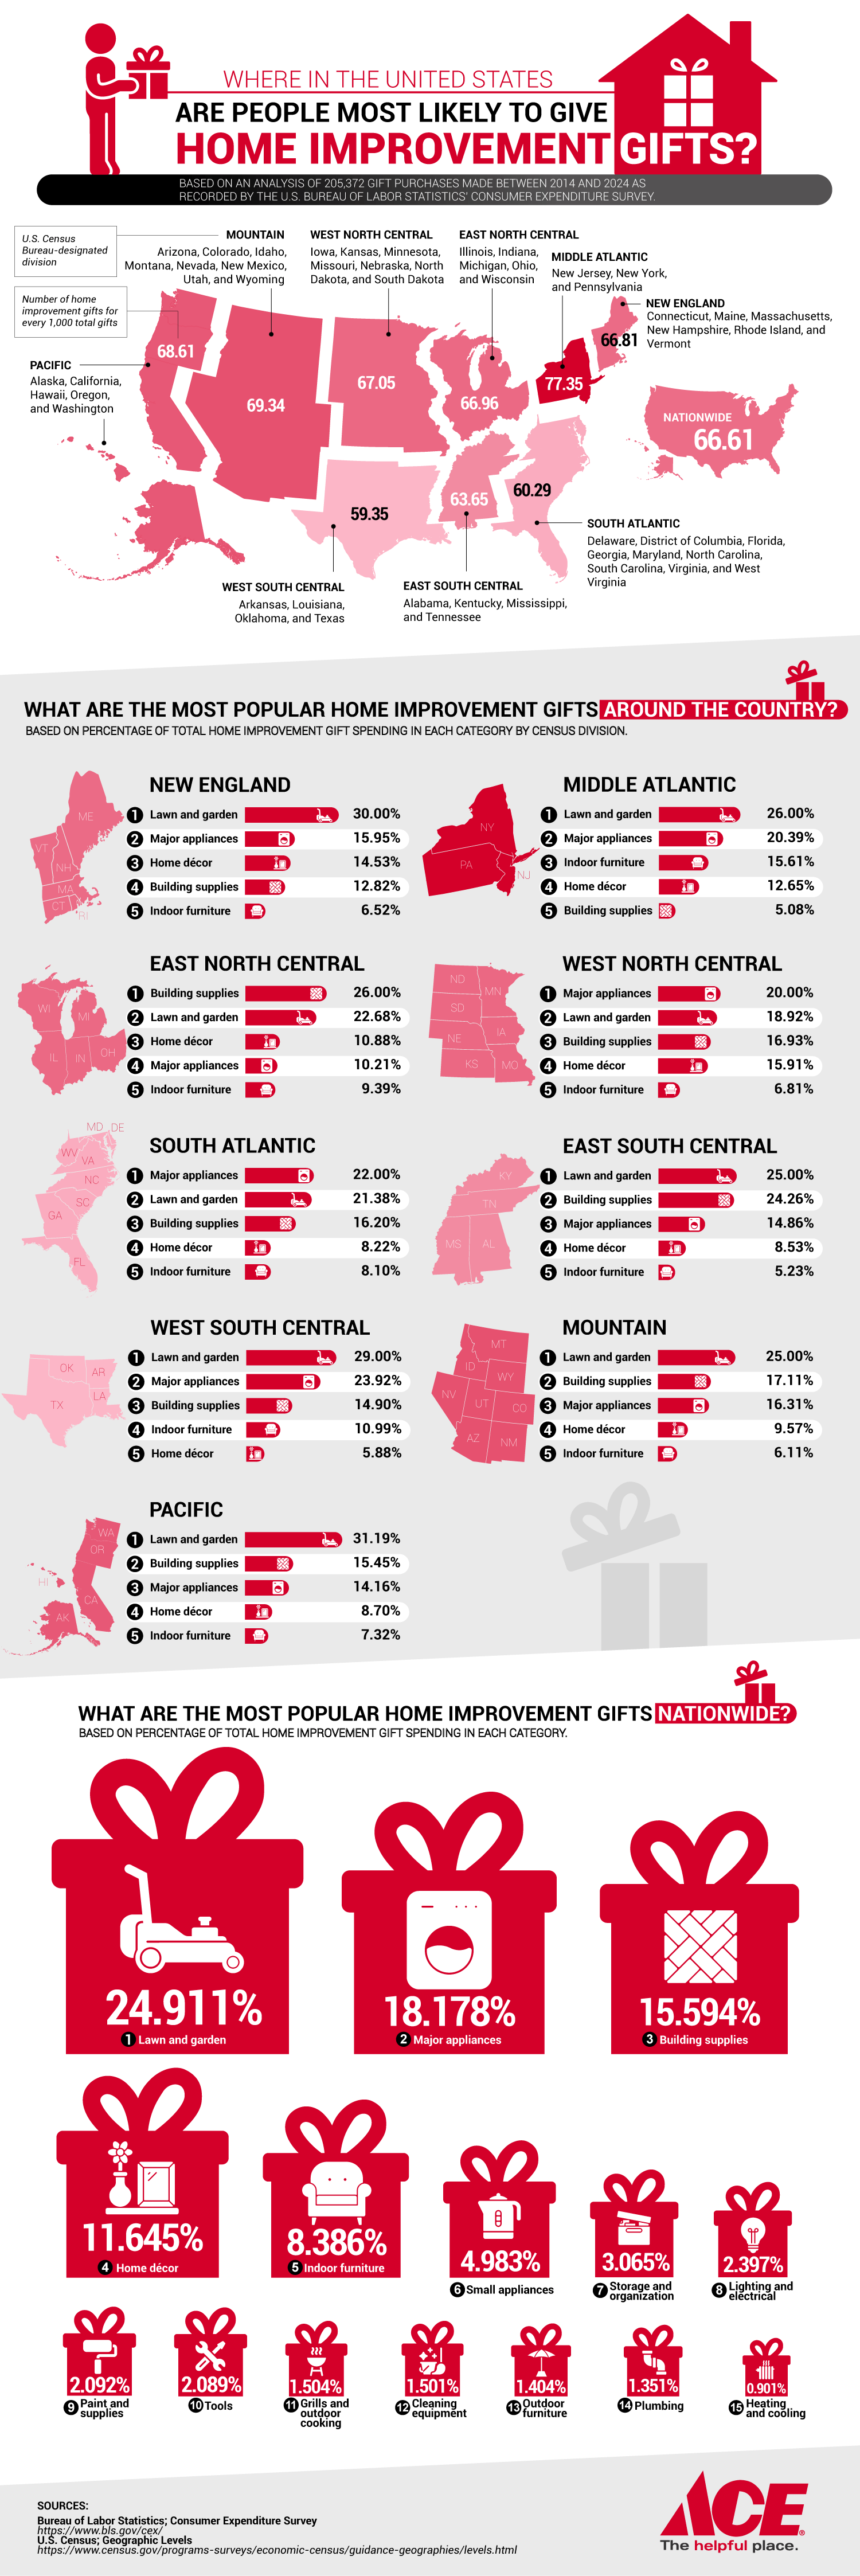
According to the team’s study, the highest amount of home improvement gift-giving occurs in the Mid-Atlantic states, particularly New York, New Jersey, and Pennsylvania. In these states, 77.35 home improvement gifts were given out of every 1,000 gifts purchased. This is a higher rate than the national average of 66.61 gifts per 1,000 gifts purchased.
The popularity of home improvement gifts in the Mid-Atlantic is likely due to the region’s older homes. The median age of a New York home is 62, higher than the national home age median of 40 to 41. Older homes need more upkeep, upgrades, and repairs, making home improvement gifts all the more valuable and appreciated. The average age of homeowners in these properties is around 58, suggesting that these older homeowners have more financial stability to invest in larger home improvement projects. Extreme weather in these regions with cold winters and variable seasons necessitates ongoing maintenance.
The team determined the most popular types of home improvement gifts. Here’s how it broke down:
- Lawn and garden supplies – 24.91% of all home improvement gifts
- Major appliances – 18.18% of all home improvement gifts
- Building supplies – 15.59% of all home improvement gifts
- Home décor – 11.65% of all home improvement gifts
- Indoor furniture – 8.39% of all home improvement gifts
- Small appliances – 4.98% of all home improvement gifts
- Storage/organization items – 3.07% of all home improvement gifts
- Lighting/electrical supplies – 2.40% of all home improvement gifts
- Paint and painting supplies – 2.09% of all home improvement gifts
- Tools – 2.09% of all home improvement gifts
These numbers show that many Americans consider home improvement gifts to be both functional and meaningful. These gifts contribute to long-term comfort and the value of a home. The numbers might reflect that home improvement gifts are shifting beyond the scope of DIY aficionados to a universally appreciated gift. As homeowners juggle time and effort on the upkeep of their homes, these gifts can make their work easier and their home more enjoyable. Home improvement items are likely to remain a major aspect of holiday gift-giving.
-

 Business Visualizations1 year ago
Everything Owned by Apple
-

 Business Visualizations1 year ago
America’s Most Valuable Companies Ranked by Profit per Employee
-

 Business Visualizations12 months ago
The Biggest Fortune 500 Company in Every State
-

 Business Visualizations9 months ago
The Biggest Employers by Industry
-

 Business Visualizations2 years ago
New Animated Map Shows Airbnb’s Fully Booked Cities Along the 2024 Eclipse Path of Totality
-

 Business Visualizations2 years ago
Everything the Luxury Giant LVMH Owns in One Chart
-

 Timelines1 year ago
Timeline Charts the Development of Communications Technology
-

 Charts2 years ago
How Many Crayola Crayon Colors Are There? A Lot.


