Business Visualizations
Which Countries Apply for the Most Trademarks Around the World?
Trademarks might not be something you think about often, but they are essential for both protecting the integrity and success of brands! The origins of trademarks can be traced back to the Stone Age; cave paintings of livestock with branding meant to identify personal property have been found. In Ancient Egypt, stones were engraved with marks to indicate the origin of the material as well as the laborer who completed the work. Since then, trademarks have evolved into legally intensive and global agents that are crucial for the flow of commerce. Every country has its own system that involves applications, fees, renewals, and more. The team at Nominus.com has created a chart that visualizes which countries apply for the most trademarks around the world.
Click below to zoom
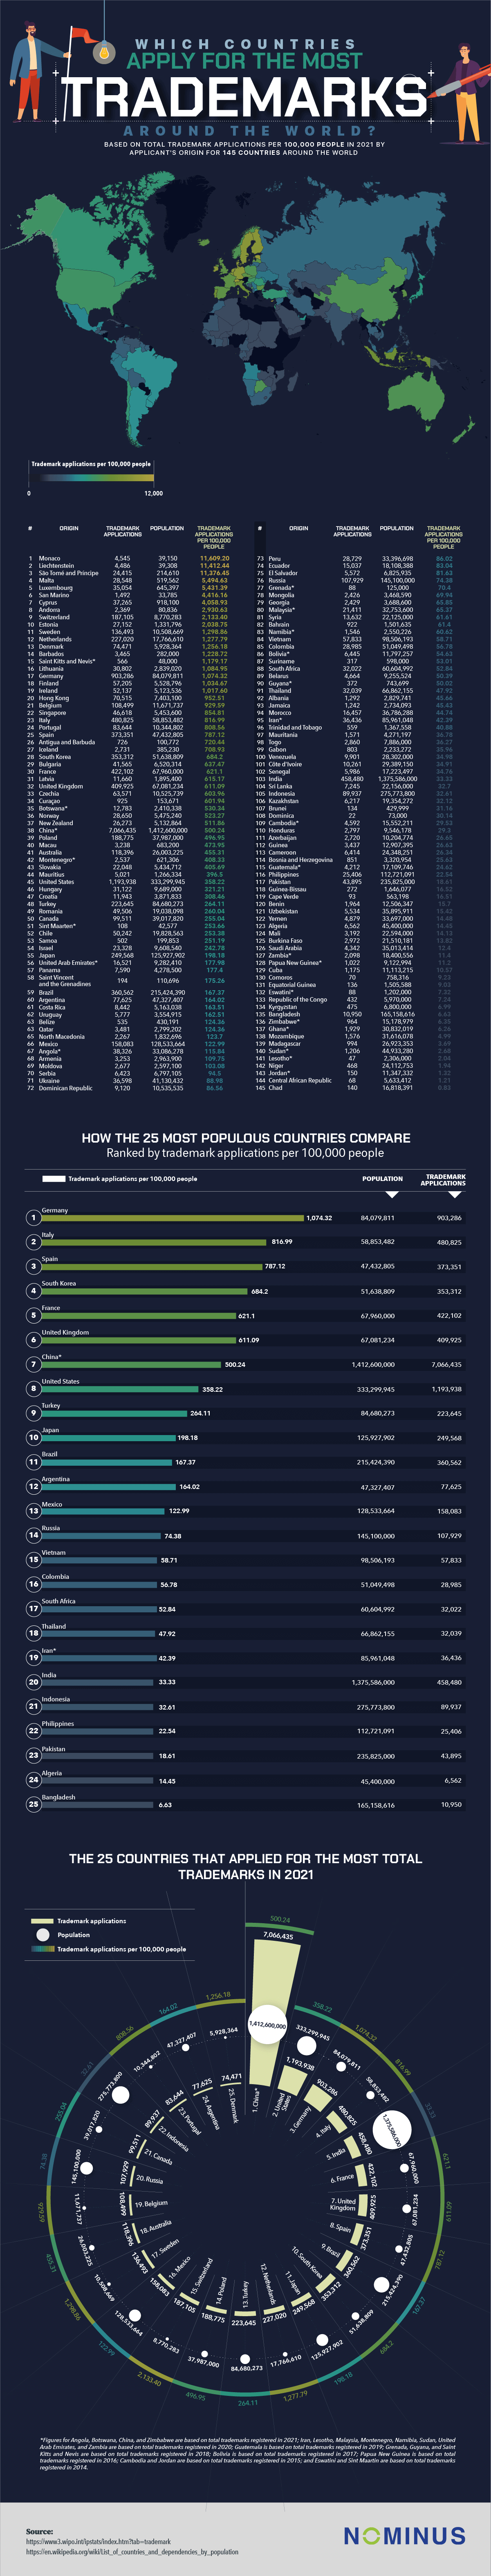
Something fascinating I have learned from this chart is that trademarks are not universal and you are only protected in the country you applied for. Fortunately, there is an epic-sounding system called the Madrid Protocol that allows you to seek protection in 129 countries at once! So what is the most “creative” country? Of course it’s far from the only measure of a country’s inventiveness, but Monaco takes the cake with 11,609.20 trademarks per capita in 2021! Out of the most populous countries, Germany applies for the most trademarks per capita. That does not surprise me as Germany has a reputation for quality, innovation, and vigorous manufacturing output. In fact, it ranks #1 in Statista’s Made-In-Country Index, which is a measure of how trusted a country’s name is on labels.
Overall, I really love the color scheme used for this chart – it’s easy on the eyes, effective, and unique. Have you ever applied for a trademark? How did you find the process? We would love to hear about your experiences in the comments below!
Logos are among the most dramatic and important aspects of marketing, shaping how consumers view a brand in ways that aren’t always visible. Logo designs are based on psychology, which informs us how shapes and colors make us feel, and how they can shape a brand’s trustworthiness and credibility. If a brand changes its logo, it must be done with care and intention, and with a clear reason to justify the switch. The team at LogoMaker displays the most effective logo switches and rebrands in a graphic based on increased web traffic.
Click below to zoom.
![]()
The team chose web traffic as an indicator of a successful logo because in the world of marketing, clicks and traffic are closely linked with sales and brand awareness. It’s a quantifiable way to measure customer behavior. The team used SEMrush traffic data to estimate traffic changes in the three months leading up to their rebrand announcement, compared with the two months after the launch. Their graph isolates traffic rates to the time of the rebrand to get the most accurate depiction of the effects. The team also helpfully included the old and new logos so readers can form their own opinions about changes.
According to the team’s results, these were the brands with the biggest traffic increases after their new logo launched:
- Pfizer
- MLB
- Premier League
- The Guardian
- Southwest
- VISA
- Target
- Jaguar
- IHOP
- Spotify
We see a wide range of industries represented in these results. Pfizer takes the lead after redesigning its logo from a pill shape to a double helix. This is also a good example of other factors, in addition to the rebrand, causing the traffic spikes. The rebrand occurred in 2021, the height of the COVID-19 pandemic, when the world was hoping for a company like Pfizer to develop an effective vaccine.
After Pfizer, we see a few sports leagues on the chart. Major League Soccer, or MLS, is in second place, followed by the UK’s Premier League in third. Both of them dramatically simplified their logos, making them clearer and possibly more memorable, as the increased traffic indicates. In fact, many of the companies on the list seem to have opted for simpler logo designs. This is quite possibly so the logos are more visible when they’re small, like on a phone screen. This could also reflect a changing aesthetic, shifting from the more stylized and classical designs of the 90s and 00s to today’s more bold, minimalist style.
The trend toward minimalist logo redesign reflects evolving consumer preferences and the demands of digital media. Companies across diverse industries, from pharmaceuticals to sports and retail, are embracing simpler, more impactful designs that enhance brand recognition and visibility in an increasingly mobile world. These changes not only boost traffic but also demonstrate how branding adapts to cultural shifts and technological advancements, helping organizations stay relevant and competitive in today’s fast-paced landscape.
Job searching is stressful and the current employment market isn’t the strongest. The Bureau of Labor Statistics (BLS) says that the average job search lasts 23.3 weeks. That’s a long haul. The World Economic Forum does see the market becoming more dynamic soon with new and emerging job opportunities. Qualtrics added to this top with a new map showing where we’ll find the most active job seekers in the U.S. They drew on data from the BLS’s American Time Use Survey.
Click below to zoom.
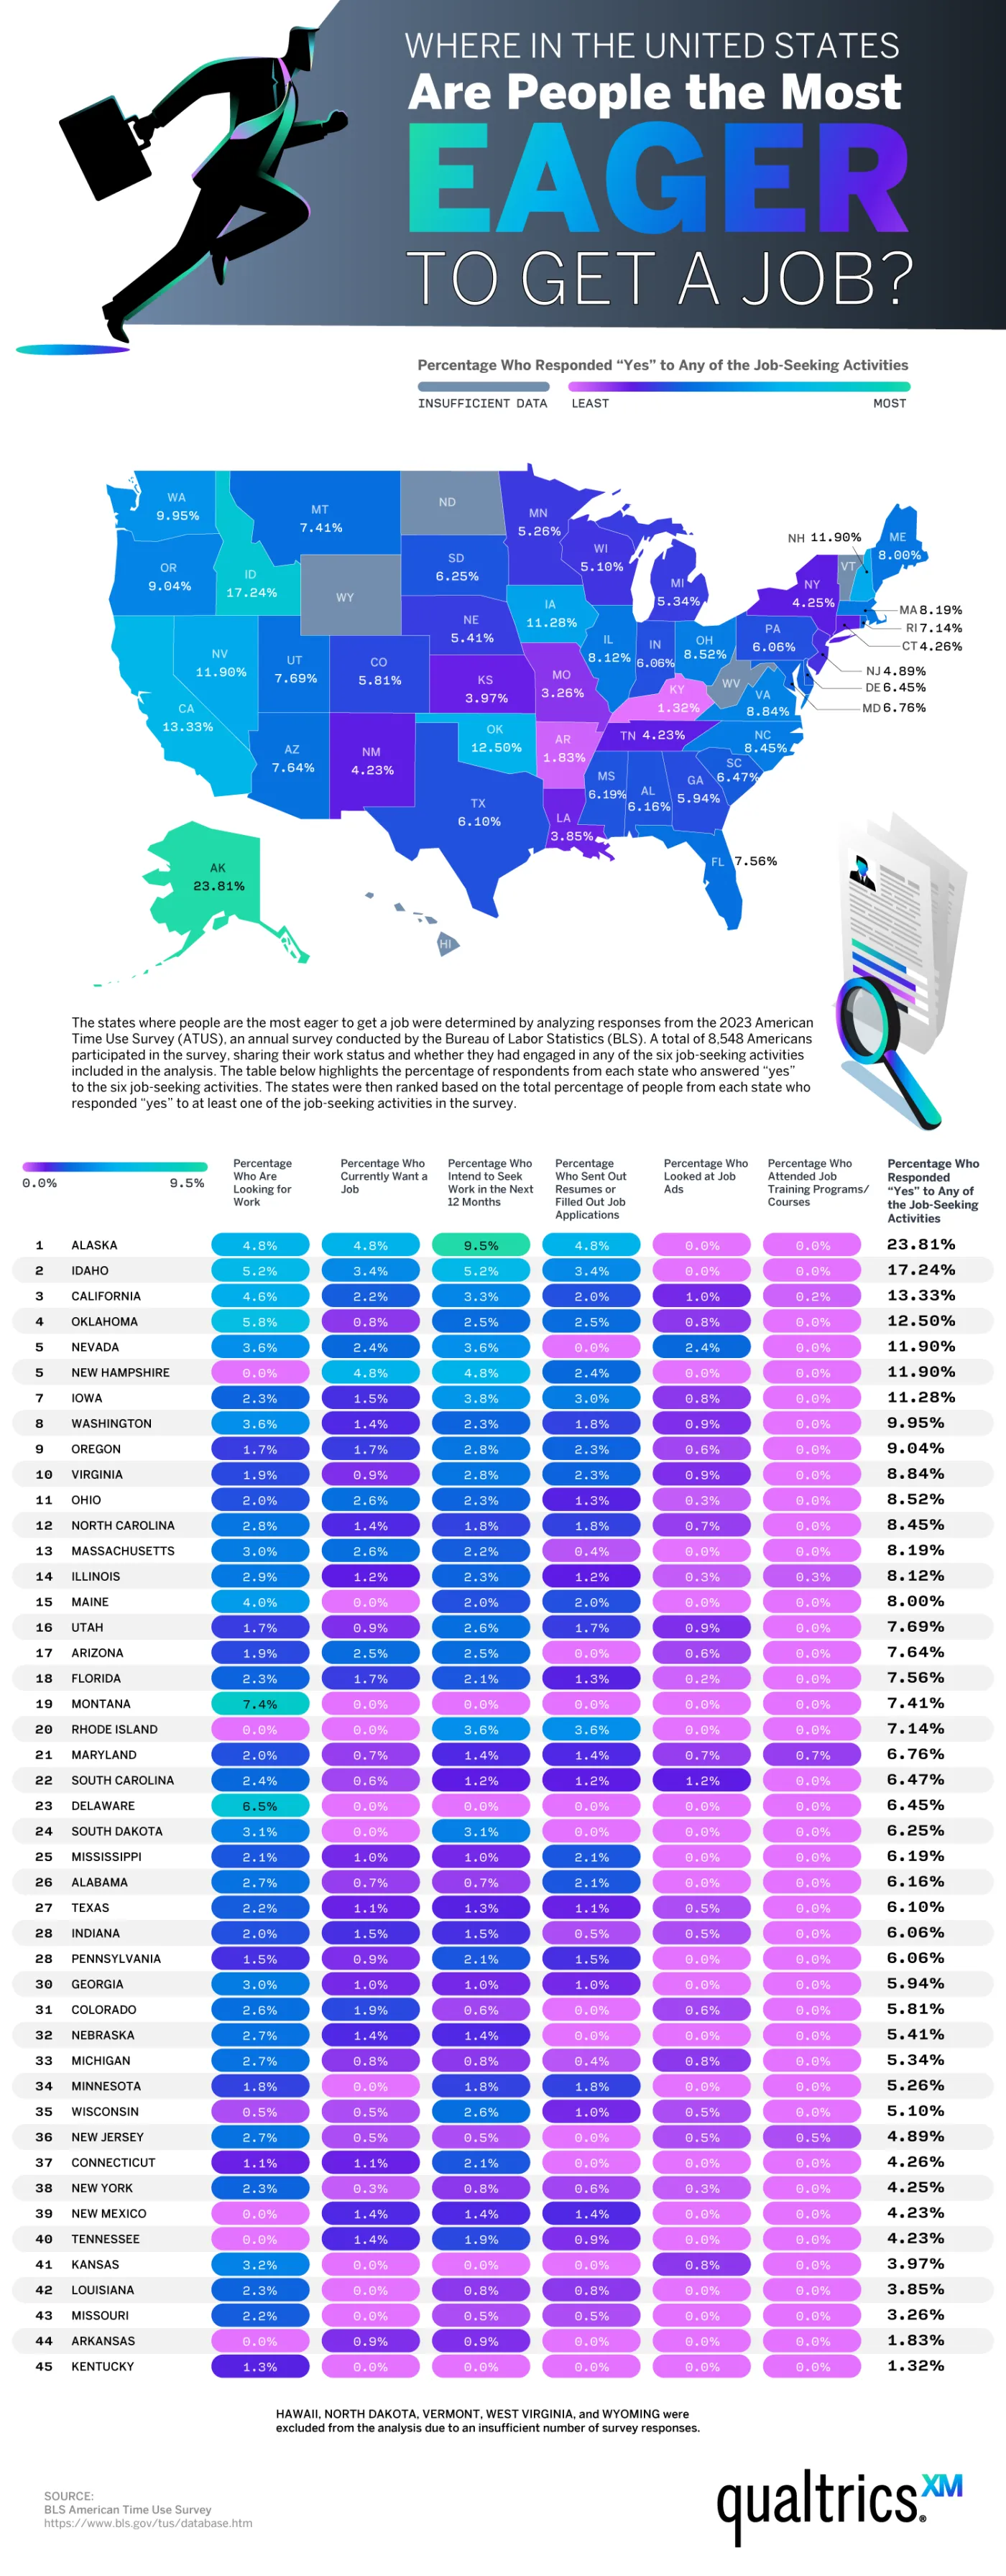
The team’s main visual for their data is a color-coded map of the 50 states, ranked by the percentage of residents who reported engaging in job-seeking activities. These could include looking for work, wanting a job, submitting applications, intending to seek work soon, looking at job ads, or attending job training. Five states had to be excluded from the ranking because of insufficient survey data. This included Hawaii, Vermont, North Dakota, West Virginia, and Wyoming.
These states were found to have the most people wanting new jobs:
- Alaska — 23.81% (standout leader)
- Idaho — 17.24%
- California — 13.33%
- Oklahoma — 12.5%
- Nevada & New Hampshire — tied at 11.9%
- Iowa — 11.28%
- Washington — 9.95%
- Oregon — 9.04%
- Virginia — 8.84%
This list shows Western and Pacific states dominating the top. Alaska as a standout leader might come as a surprise because it’s not due to a job shortage. There is actually a workforce shortage in Alaska. In 2024, Alaska created 5,400 new jobs with more expected in 2025. $20 billion in infrastructure development is expected to generate 20,000 more jobs by 2030. So, Alaska’s high job-seeking activity reflects a growing, dynamic economy with ample room for pivots and career changes.
States with the lowest rankings were Kentucky (1.32%), Arkansas (1.83%), and Missouri (3.26%). These states may have lower unemployment rates, different market conditions, or demographic factors that influenced their ranking. The data make it clear that job-seeking activity varies widely by state, tied to local economic conditions, perhaps more so than national trends. Job seekers should take advantage of training programs, the federal jobs board, and role-specific job search sites. It also shows that securing talent is only one step toward building a loyal, long-term workforce. Only 42% of workers feel engaged, which is a major reason they may seek new jobs.
Beyond a snapshot of where Americans are currently looking for work, these data points to a bigger reality: labor-market “energy” is uneven, and high job-seeking activity can signal opportunity as much as instability. In states like Alaska, movement may reflect an expanding, restructuring economy in which workers feel empowered (or required) to pivot as new roles and industries emerge. For job seekers, the practical takeaway is to align search strategy with local conditions. Prioritize skills-building and credentials that travel across employers, use targeted boards and training pipelines, and treat mobility as a long-term advantage rather than a short-term disruption. Organizations and individuals that read these regional signals early and invest accordingly will be best positioned to thrive as the economy continues to evolve.
Business Visualizations
Research Uncovers the Industries with the Highest Turnover Rates in the U.S.
The Qualtrics research team examined the employee turnover rates across American industries to identify which sectors struggle the most with workforce retention and which offer the greatest stability. The team defined a turnover rate as the percentage of hires, layoffs, and quits among an industry’s workforce. Turnover rates can vary widely across industries and can indicate a range of conditions for workers, from economic instability to dangerous jobs with high injury rates. High turnover can also be very costly for the businesses within those industries.
Click below to zoom.
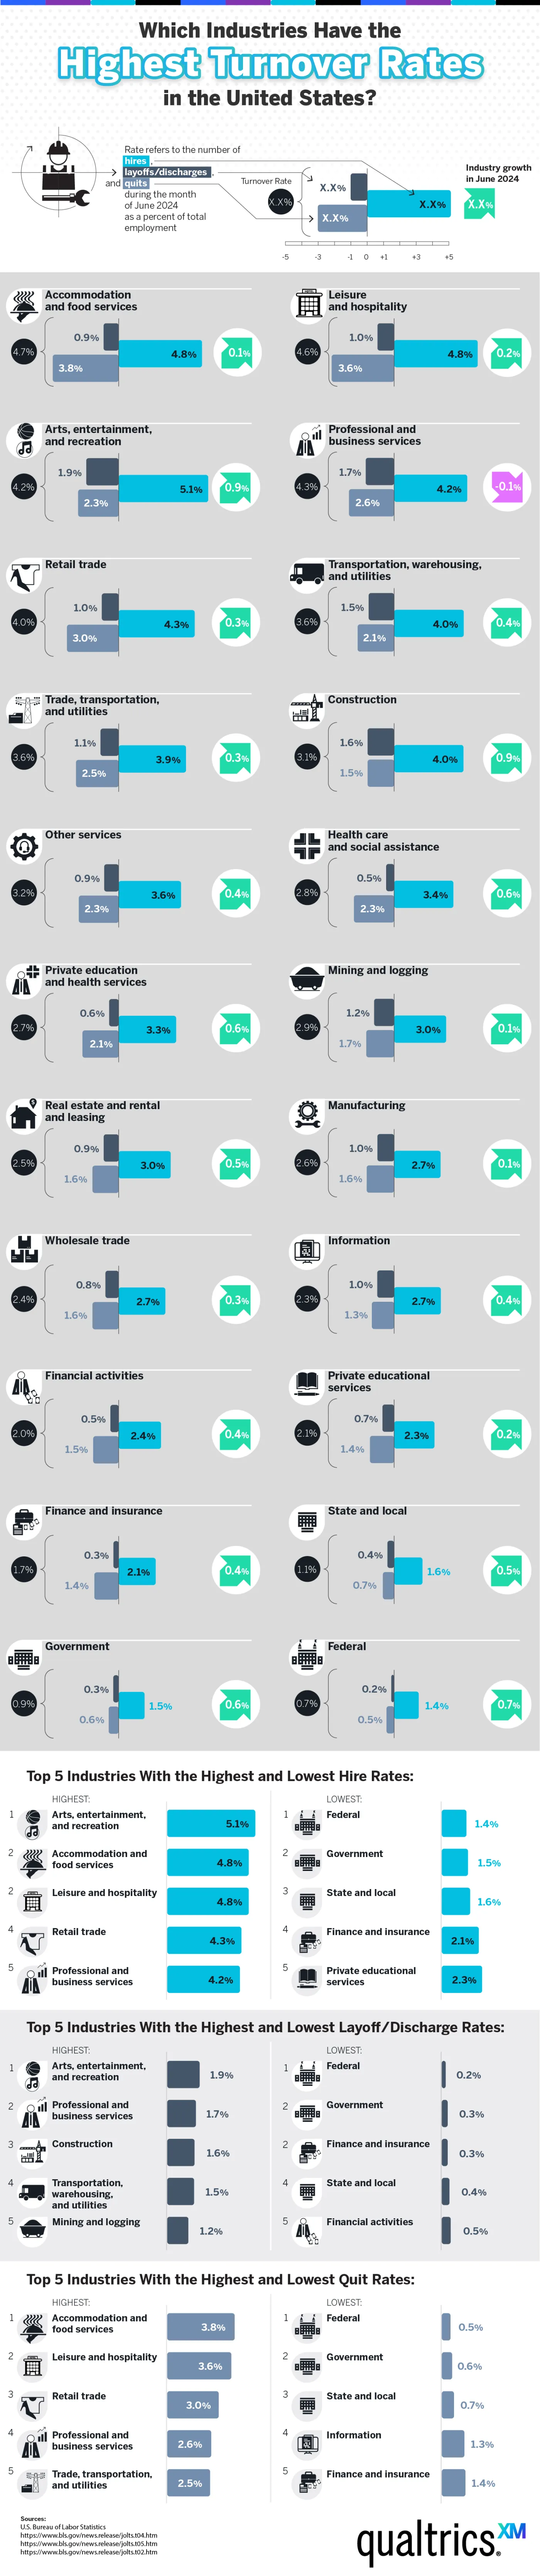
The team created a chart to visualize data from the Bureau of Labor Statistics. They measured hire rates, layoff/discharge rates, and quit rates. Here are the top 5 results from each category:
The highest hiring rates: Arts, entertainment, and recreation; accommodation and food services; leisure and hospitality; retail trade; and professional and business services.
The highest layoff/discharge rates: Arts, entertainment, and recreation; professional and business services; construction; transportation, warehousing, and utilities; and mining and logging.
The highest quit rates: Accommodation and food services; leisure and hospitality; retail trade; professional and business services; trade, transportation, and utilities.
Arts and entertainment stand out as a highly unstable industry with high hiring and layoff rates, meaning it has by far the highest turnover. On the low end of these measures, we find the federal government and finance sectors.
High turnover rates should concern more than employees. They don’t favor businesses either. Hiring new workers can be very expensive, as the business must cover job advertising, recruitment agency fees, training costs, and other onboarding expenses. According to Cornell University, it costs an average of $5,864 to replace an employee. If we examine the high-turnover food service industry, we find that a restaurant with 50 employees would need to replace two employees per month at a 4.7% turnover rate. Over the course of the year, replacing two employees a month would cost the restaurant $150,000. Setting aside the costs, high turnover can disrupt workflow and add workload and stress for staff, lowering morale, quality, and brand reputation. We saw this happen in another high-turnover industry. Both the Screen Actors’ Guild and the Writers’ Guild have made headlines for massive strikes that delayed film projects for years.
The team pointed out that a report from the Society for Human Resource Management identified the top three reasons for turnover as employee dissatisfaction with compensation, lack of career development, and workplace inflexibility. These are all common factors in the industries with the highest rates. Industries like food service, retail, and hospitality all have high levels of burnout, employees who feel they’re in stagnant careers, and demanding schedules that require work on weekends and holidays. These factors create unsatisfied workers who don’t stick around in the industry.
The COVID-19 pandemic led many people to consider the importance of workplace safety and a work culture that makes employees feel the company takes their health seriously. There were high turnover rates during this time across industries, and we learned that many companies fell short in protecting workers from illness. The Qualtrics study is packed full of data points with far-reaching implications like these.
-

 Business Visualizations2 years ago
Everything Owned by Apple
-

 Business Visualizations2 years ago
America’s Most Valuable Companies Ranked by Profit per Employee
-

 Business Visualizations1 year ago
The Biggest Fortune 500 Company in Every State
-

 Business Visualizations12 months ago
The Biggest Employers by Industry
-

 Timelines2 years ago
Timeline Charts the Development of Communications Technology
-

 Business Visualizations7 months ago
The Largest Companies in America That Are Still Run by the Person Who Founded Them
-

 Maps2 years ago
A Map to Gold and Silver
-
 Timelines2 years ago
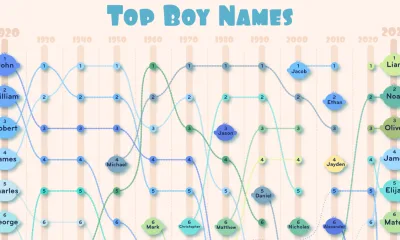
The Evolution of Baby Names: A Century of Trends