Charts
What Do You Get When You Combine Over 600 Superheros and Villains: The Giant-Size Omnibus of Superpowers
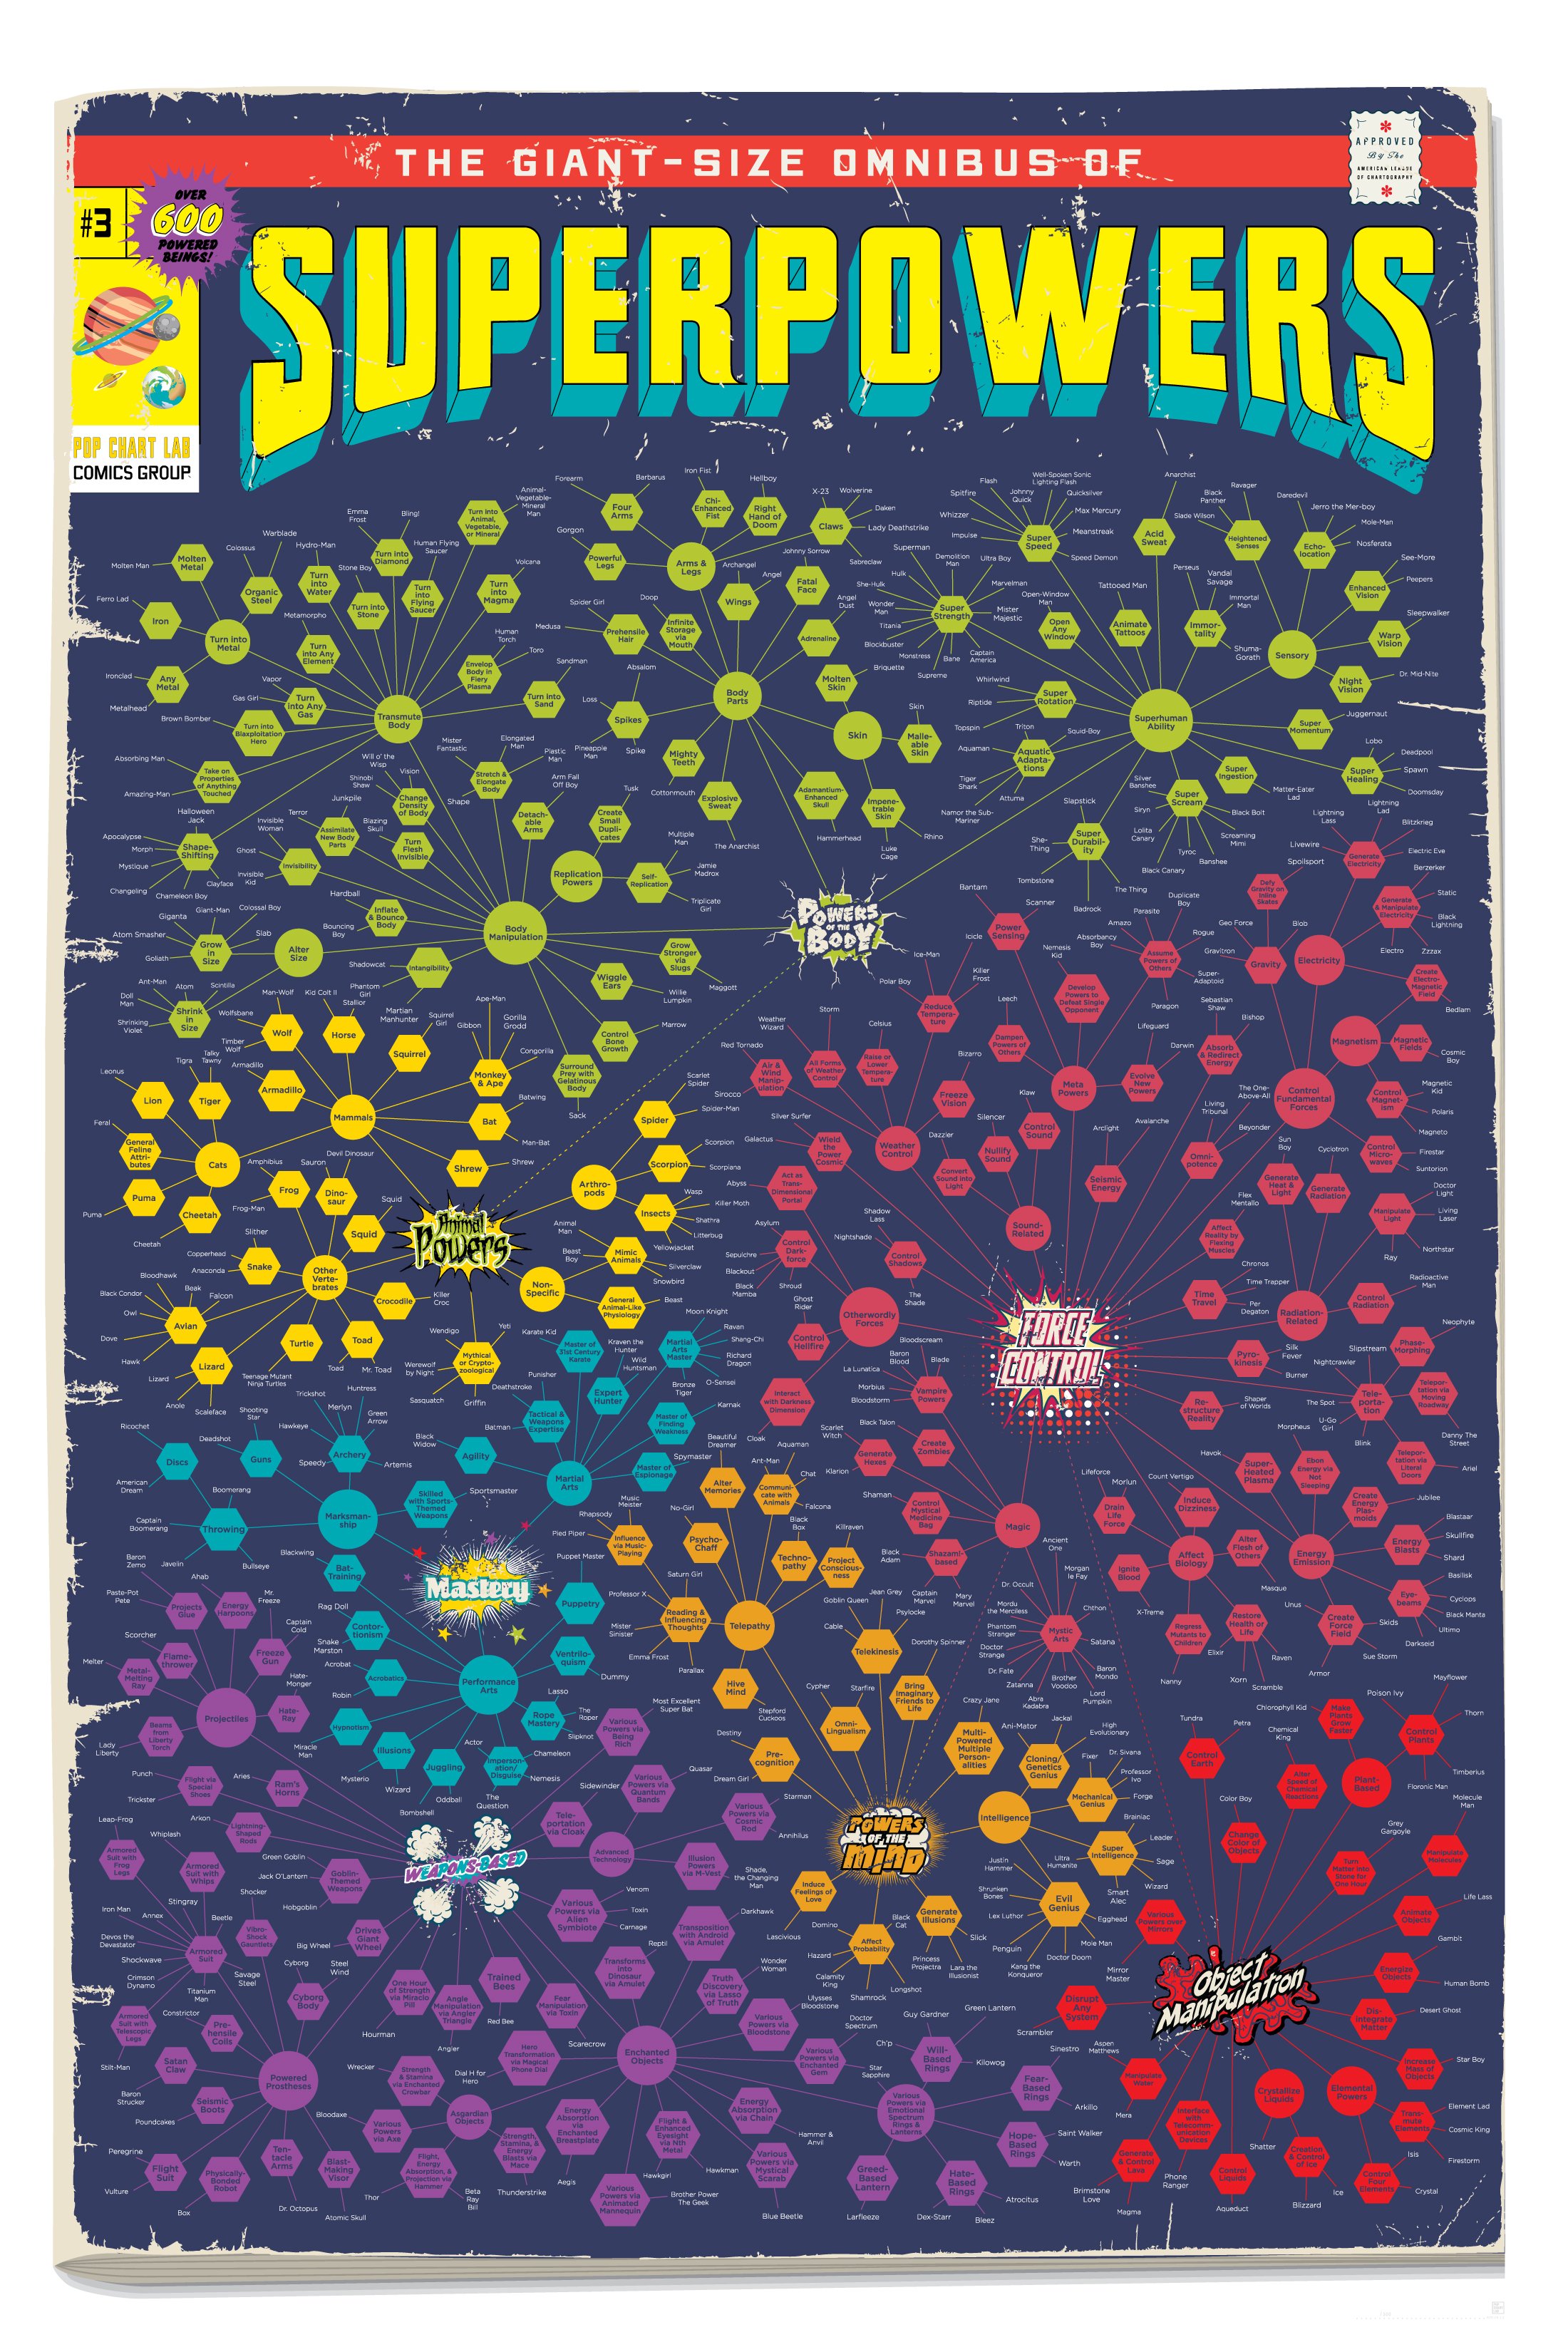
If you could have any superpower, which one would it be? If you ask yourself this question often, then this is the guide for you. The Giant-Size Omnibus of Superpowers is bursting at the seams with a collection of the many superpowers that can be found in our favorite fictional universes. Pop Chart, the creator of the guide, refers to it as “The universe’s most extensive charting of superpowers”, and we’d have to agree as it features more than 600 superheros and villains and the 200 powers that they share.
Click below to zoom

We came across this guide when it was shared by Reddit user, u/Lixiviate, as a more comprehensive follow-up to an older version of the guide that had been posted by u/Chained_Escapist. And we’re so glad they did as we dive down this rabbit hole of the many incredible superpowers that have helped wage wars and defeat bad guys, and left us envious that we weren’t able to harness those same powers. Not to mention, the updated design into that of a comic book cover is wonderfully done and you can’t help but to feel nostalgic when you look at it.
These 200 superpowers have been broken down into seven different categories of powers. They include powers of the body, force control, animal powers, object manipulation, powers of the mind, mastery powers such as martial arts and marksmanship, and weapon-based powers. The powers included within each category are more impressive than the last.
So now that you have these 200 options to choose from, if you could have any one superpower which would it be?
Charts
The Home Improvement Projects with the Strongest ROI
Deciding which home improvement projects are worth your time and money can yield big payoffs. Whether you think you’ll sell yourself soon or want to increase your comfort and value, you can use this new study from Ace Handyman Services to decide which projects to tackle. Their article “Which Handyman Home Improvement Projects have the Biggest ROI?” pinpoints the upgrades and repairs that will give you the greatest return on investment.
Click below to zoom.
The study focuses on cost-effective projects that offer a tangible increase in home value. These projects will improve the home’s functionality and make it look more cared for. Both qualities are appealing to potential buyers. Some of the top upgrades the team lists are garage door replacement, new entry doors, refinishing floors, fixing siding, and painting the walls. Landscaping and proper lawn care also go a long way toward increasing curb appeal. Nationwide surveys show that simple cosmetic upgrades can add over 100% of the project’s cost to the home’s value. This is particularly true if you paint in neutral or modern colors.
Experts also point to kitchen and bathroom improvements as good, modest cost investments. Replacing fixtures and cabinets can make a big difference. National data points to small-scale kitchen remodels recouping 80% to 96% of their costs, which is a much better ROI than big, expensive remodeling overhauls. We see in the team’s data that flooring and exterior upgrades also have a major impact. Well-maintained and upgraded floors are often worth more than the cost to do the project. New hardwood floors or sanding and refinishing floors add around $5,000 of resale value. A lawn care service has an enormous ROI of 217%, underscoring the massive impact of curb appeal. Upgraded landscaping can add $9,000 in value, and even simple landscape lighting can add around $4,000. You could also consider adding an outdoor fire feature, which would add $5,000 in value.
Overall, these projects had the highest ROI:
- Replacing the garage door
- Standard lawn care service
- Replace the entry door
- Install manufactured stone veneer
- Sand and refinish hardwood floors
- Install new hardwood floors
- Replace siding
- Paint interior
- Landscape maintenance
- Upgrade the landscape
The biggest message the team’s study underscores is that handyman projects can outperform big remodels and renovations in terms of increased home value. These handyman-friendly projects that the average DIYer can achieve represent a balance of cost-effectiveness, value impact, and everyday comfort enhancement. Always lean toward adding visual appeal and increasing functionality when deciding on ways to improve your home. The projects on this list will help you make a more beautiful, comfortable home without breaking your back. Whether you hire a handyman service or take on the project yourself, these projects are within your grasp and will give you a solid return on the investment.
Charts
The Most Dangerous Places to Drive on New Year’s
Millions of Americans travel for New Year’s Eve and Day celebrations, but unfortunately, the last night of the year can be one of the most dangerous for drivers. CarInsurance.com analyzed data from the National Highway Traffic Safety Administration to find that certain states and counties have consistently higher fatality rates on December 31 and January 1. The team identified where and when the risks are highest.
Click below to zoom.
The team’s analysis examined NHTSA fatality numbers between 2014 and 2023, then adjusted this data relative to population to calculate the number of fatalities per 100,000 residents. They discovered that these states had the highest per-capita traffic deaths on New Year’s Eve:
- South Carolina – 1.39 deaths per 100,000 (71 total)
- Mississippi – 1.35 deaths per 100,000 (40 total)
- Louisiana – 1.33 deaths per 1000,000 (62 total)
Florida was also a high-risk location. Its deaths per capita rank fourth on the list, but the total number of New Year’s Eve fatalities are much higher than the top three states, with 270 deaths in total. This is largely due to Florida’s large population and number of dangerous counties.
Focusing on these high-risk counties revealed some especially hazardous locations. The deadliest U.S. counties on New Year’s Eve and Day were:
- Sarasota County, Florida – 2.3 fatalities per 100,000 (10 deaths)
- Manatee County, Florida – 2.0 per 100,000 (8 deaths)
- Davidson County, Tennessee – 1.96 per 100,000 (14 deaths)
Sarasota and Manatee counties are both linked to high rates of DUI-related traffic fatalities, which can help explain their placement at the top of the list.
The danger not only varies by place, but by the time of day. On New Year’s Eve, the deadliest hours occur between 2 a.m. and 3 a.m. for 38 recorded fatalities. On New Year’s Day, the early morning hours are by far the most dangerous, with 137 deaths occurring between 2 a.m. and 3 a.m. and 131 deaths between 1 a.m. and 2 a.m.
Over the decades, we see 1,047 deaths on December 31st and 1,474 on January 1st, so New Year’s Day has the most fatalities overall, which is probably due to partygoers under the influence returning home in the early morning hours.
The largest contributor to New Year’s traffic deaths is certainly alcohol impairment. For example, in 2022, 37% of deadly crashes on New Year’s Day involved an alcohol impaired driver. This number varies year-to-year, but it does highlight how common drunk driving is during holiday celebrations.
This pattern aligns with a broader national trend of alcohol-impaired driving leading to traffic fatalities. In 2023, a third of U.S. traffic deaths involved drunk drivers, prompting campaigns run during the holiday period with slogans like, “Drive sober or get pulled over.”
Understanding the safety facts the team outlined can help drivers make safe decisions over the holidays. We can see from the data that they should avoid driving between 1 a.m. and 3 a.m. on New Year’s Eve and New Year’s Day. They should arrange a sober ride and never drive under the influence. Always wear a seatbelt and be extra alert when driving.
Charts
The States Where Americans Give Hardware and Home Improvement Gifts
As the holidays approach, American families are thinking about gift-giving, and a trend stands out: Americans are giving home improvement and hardware items as useful and practical gifts. According to an Ace Hardware analysis of Bureau of Labor Statistics Consumer Expenditure Survey data spanning a decade of gift purchases, some regions are more likely to gift-wrap DIY tools, garden supplies, and appliances.
Click below to zoom.
Home ownership and upkeep are a major part of the American lifestyle. The team’s study found that 79% of homeowners undertake multiple home improvement projects each year, with many completing three or more. Americans spent $526 billion on home improvement in 2024. The number of projects per household has increased from 2.7 in 2015 to 3.4 in 2023. This commitment to home maintenance explains why hardware and home improvement supplies are a reliable gift choice, especially for people who live in older homes or in harsh climates.
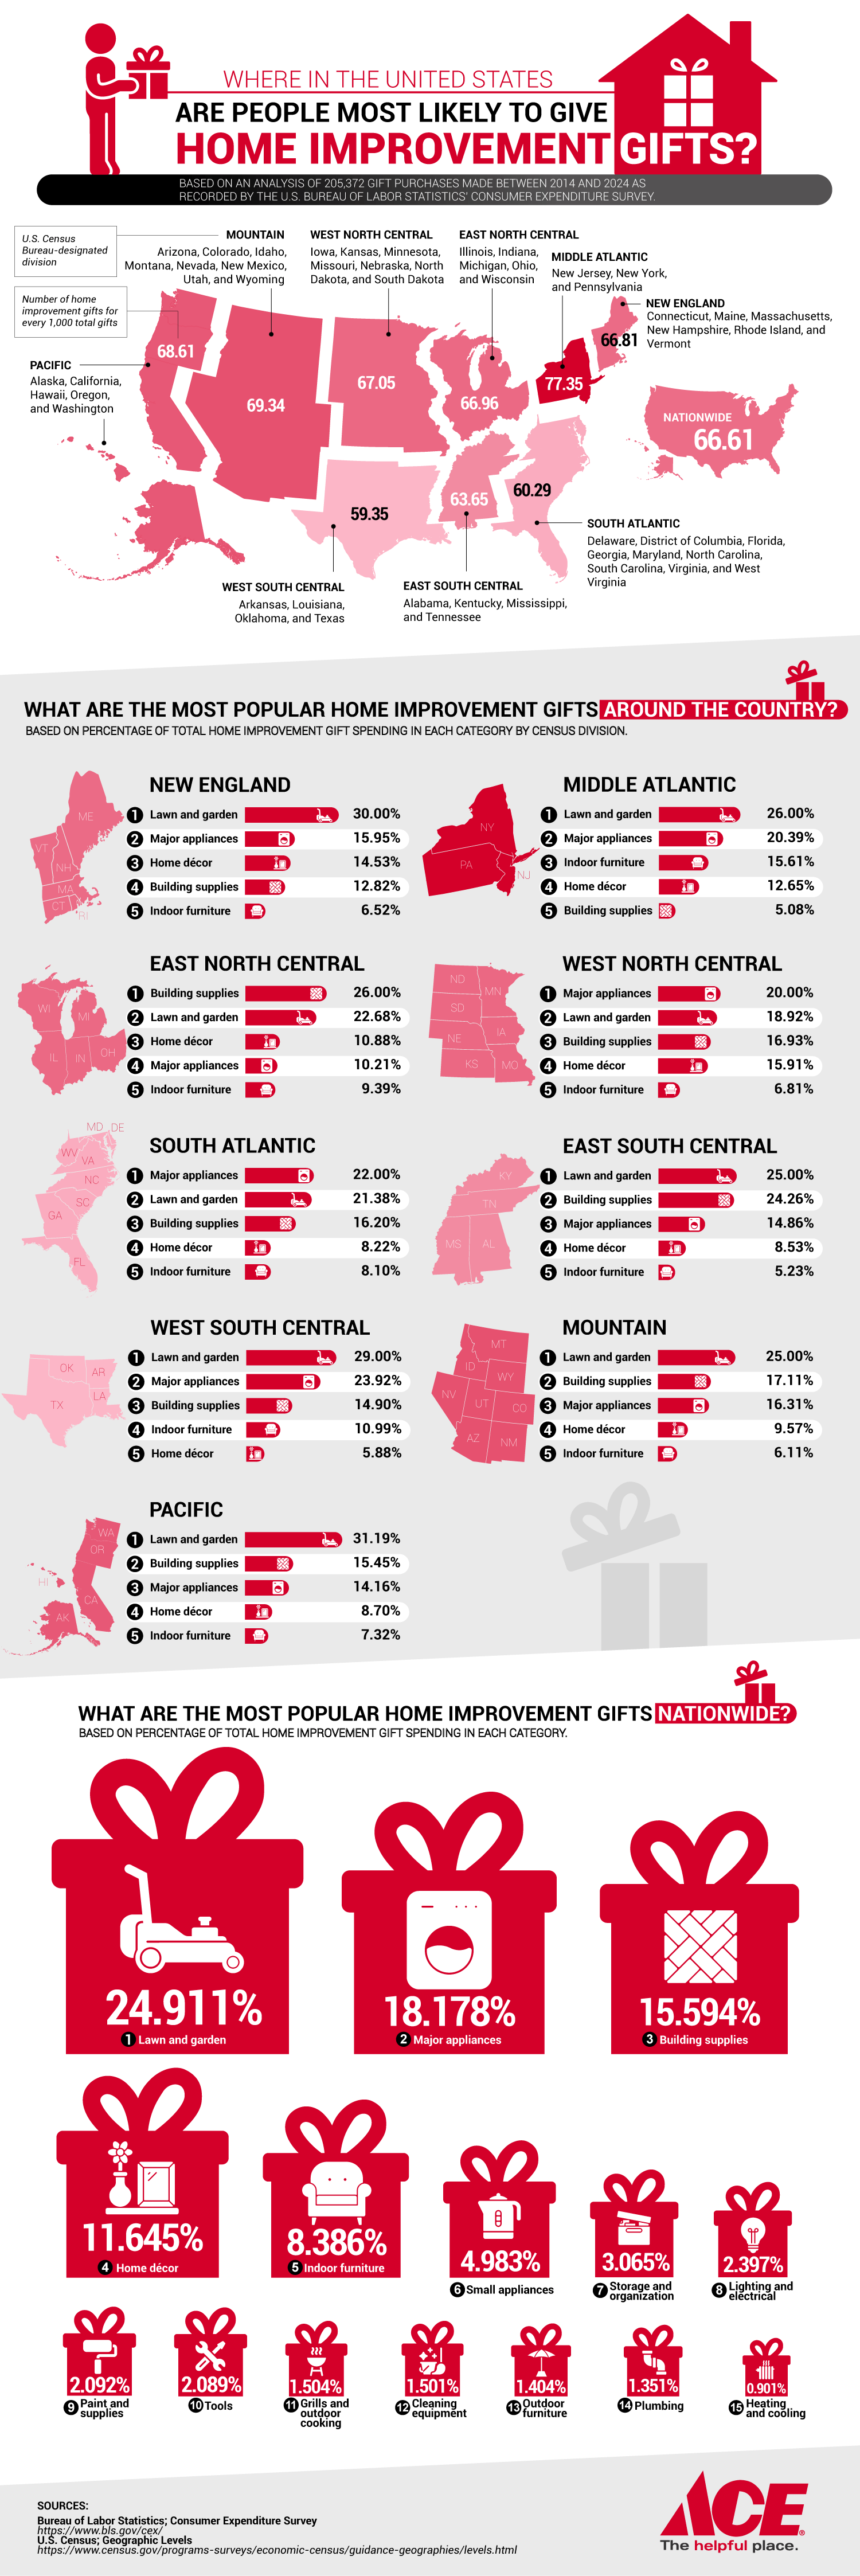
According to the team’s study, the highest amount of home improvement gift-giving occurs in the Mid-Atlantic states, particularly New York, New Jersey, and Pennsylvania. In these states, 77.35 home improvement gifts were given out of every 1,000 gifts purchased. This is a higher rate than the national average of 66.61 gifts per 1,000 gifts purchased.
The popularity of home improvement gifts in the Mid-Atlantic is likely due to the region’s older homes. The median age of a New York home is 62, higher than the national home age median of 40 to 41. Older homes need more upkeep, upgrades, and repairs, making home improvement gifts all the more valuable and appreciated. The average age of homeowners in these properties is around 58, suggesting that these older homeowners have more financial stability to invest in larger home improvement projects. Extreme weather in these regions with cold winters and variable seasons necessitates ongoing maintenance.
The team determined the most popular types of home improvement gifts. Here’s how it broke down:
- Lawn and garden supplies – 24.91% of all home improvement gifts
- Major appliances – 18.18% of all home improvement gifts
- Building supplies – 15.59% of all home improvement gifts
- Home décor – 11.65% of all home improvement gifts
- Indoor furniture – 8.39% of all home improvement gifts
- Small appliances – 4.98% of all home improvement gifts
- Storage/organization items – 3.07% of all home improvement gifts
- Lighting/electrical supplies – 2.40% of all home improvement gifts
- Paint and painting supplies – 2.09% of all home improvement gifts
- Tools – 2.09% of all home improvement gifts
These numbers show that many Americans consider home improvement gifts to be both functional and meaningful. These gifts contribute to long-term comfort and the value of a home. The numbers might reflect that home improvement gifts are shifting beyond the scope of DIY aficionados to a universally appreciated gift. As homeowners juggle time and effort on the upkeep of their homes, these gifts can make their work easier and their home more enjoyable. Home improvement items are likely to remain a major aspect of holiday gift-giving.
-

 Business Visualizations1 year ago
Everything Owned by Apple
-

 Business Visualizations1 year ago
America’s Most Valuable Companies Ranked by Profit per Employee
-

 Business Visualizations11 months ago
The Biggest Fortune 500 Company in Every State
-

 Business Visualizations8 months ago
The Biggest Employers by Industry
-

 Business Visualizations2 years ago
New Animated Map Shows Airbnb’s Fully Booked Cities Along the 2024 Eclipse Path of Totality
-

 Business Visualizations2 years ago
Everything the Luxury Giant LVMH Owns in One Chart
-

 Business Visualizations2 years ago
Timeline Shows the Top 10 Most-Visited Websites Each Year Since 1995
-

 Timelines1 year ago
Timeline Charts the Development of Communications Technology


