Charts
Where in the U.S. Have the Highest (and Lowest) High School Graduation Rates?
The United States is a colossal country with an incredible range of beliefs, livelihoods, and experiences. One thing that unifies the vast majority of America is school. Federal laws require that children receive some form of education (public, private, homeschooling, etc.) for a period of time. In 2021, the average high school graduation rate in the United States was 85.3%. This incredibly detailed chart by the U.S. Career Institute explores how this rate varies across U.S. counties.
Click below to zoom
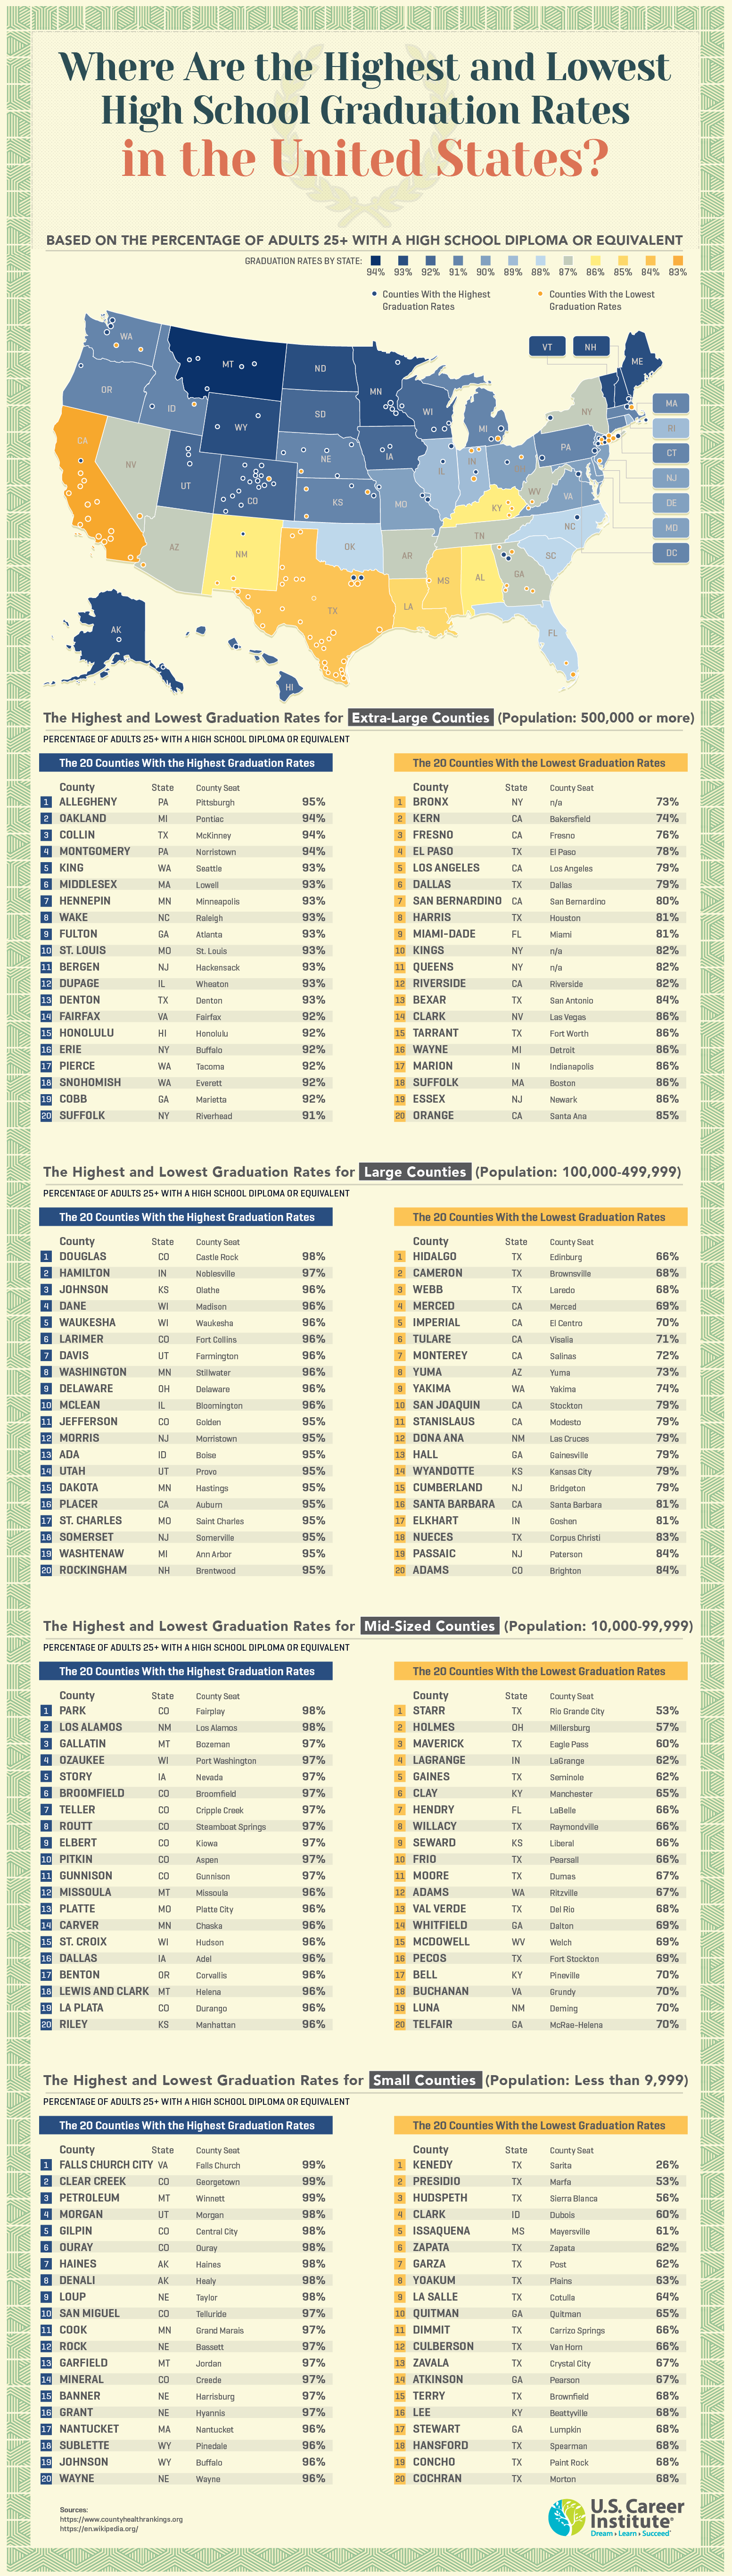
Visually, I really appreciate the use of formal, “prestigious” colors for the heat map and throughout the chart. The header font is excellent; I am planning to use it in some of my own projects! The diploma-like border is a nice touch. Let’s take a closer look at the extra-large and small counties so we can get a more complete picture of how graduation rates vary across America.
Here are the top five extra-large counties with the high school highest graduation rates:
- Alleghany, Pennsylvania – 95%
- Oakland, Michigan – 94%
- Collin, Texas – 94%
- Montgomery, Pennsylvania – 94%
- King, Washington – 93%
And here are the five extra-large counties with the lowest high school graduation rates:
- Bronx, NY – 73%
- Kern, California – 74%
- Fresno, California – 76%
- El Paso, Texas – 78%
- Los Angeles, California – 79%
Here are the top 5 small counties with the highest high school graduation rates:
- Falls Church City, Virginia – 99%
- Clear Creek, Colorado – 99%
- Petroleum, Montana – 99%
- Morgan, Utah – 98%
- Gilpin, Colorado – 98%
And lastly, here are the top 5 small counties with the lowest high school graduation rates:
- Kenedy, Texas – 26%
- Presidio, Texas – 53%
- Hudspeth, Texas – 56%
- Clark, Idaho – 60%
- Issaquena, Mississippi – 61%
I suppose not everything is bigger in Texas after all. All kidding aside, I looked into why the education system in Texas is failing so many children. Some issues I encountered are low teacher salary, dropouts from traditional schooling in favor of trade school or other alternatives, gun violence, mental health struggles, and conflict surrounding how to assess children’s performance. It is such a massive state, so it is no wonder that reform comes slowly and with a lot of resistance.
AI is embedded in workplaces worldwide by this point, and yet workers’ feelings about it vary dramatically. A study by Qualtrics examined how geography was related to feelings about AI in the workplace. They found that only 37% of workers globally believed that AI would improve their jobs. That average hides a 45-point difference between the most optimistic country, which is China, and the most skeptical, Japan.
Click here to zoom.
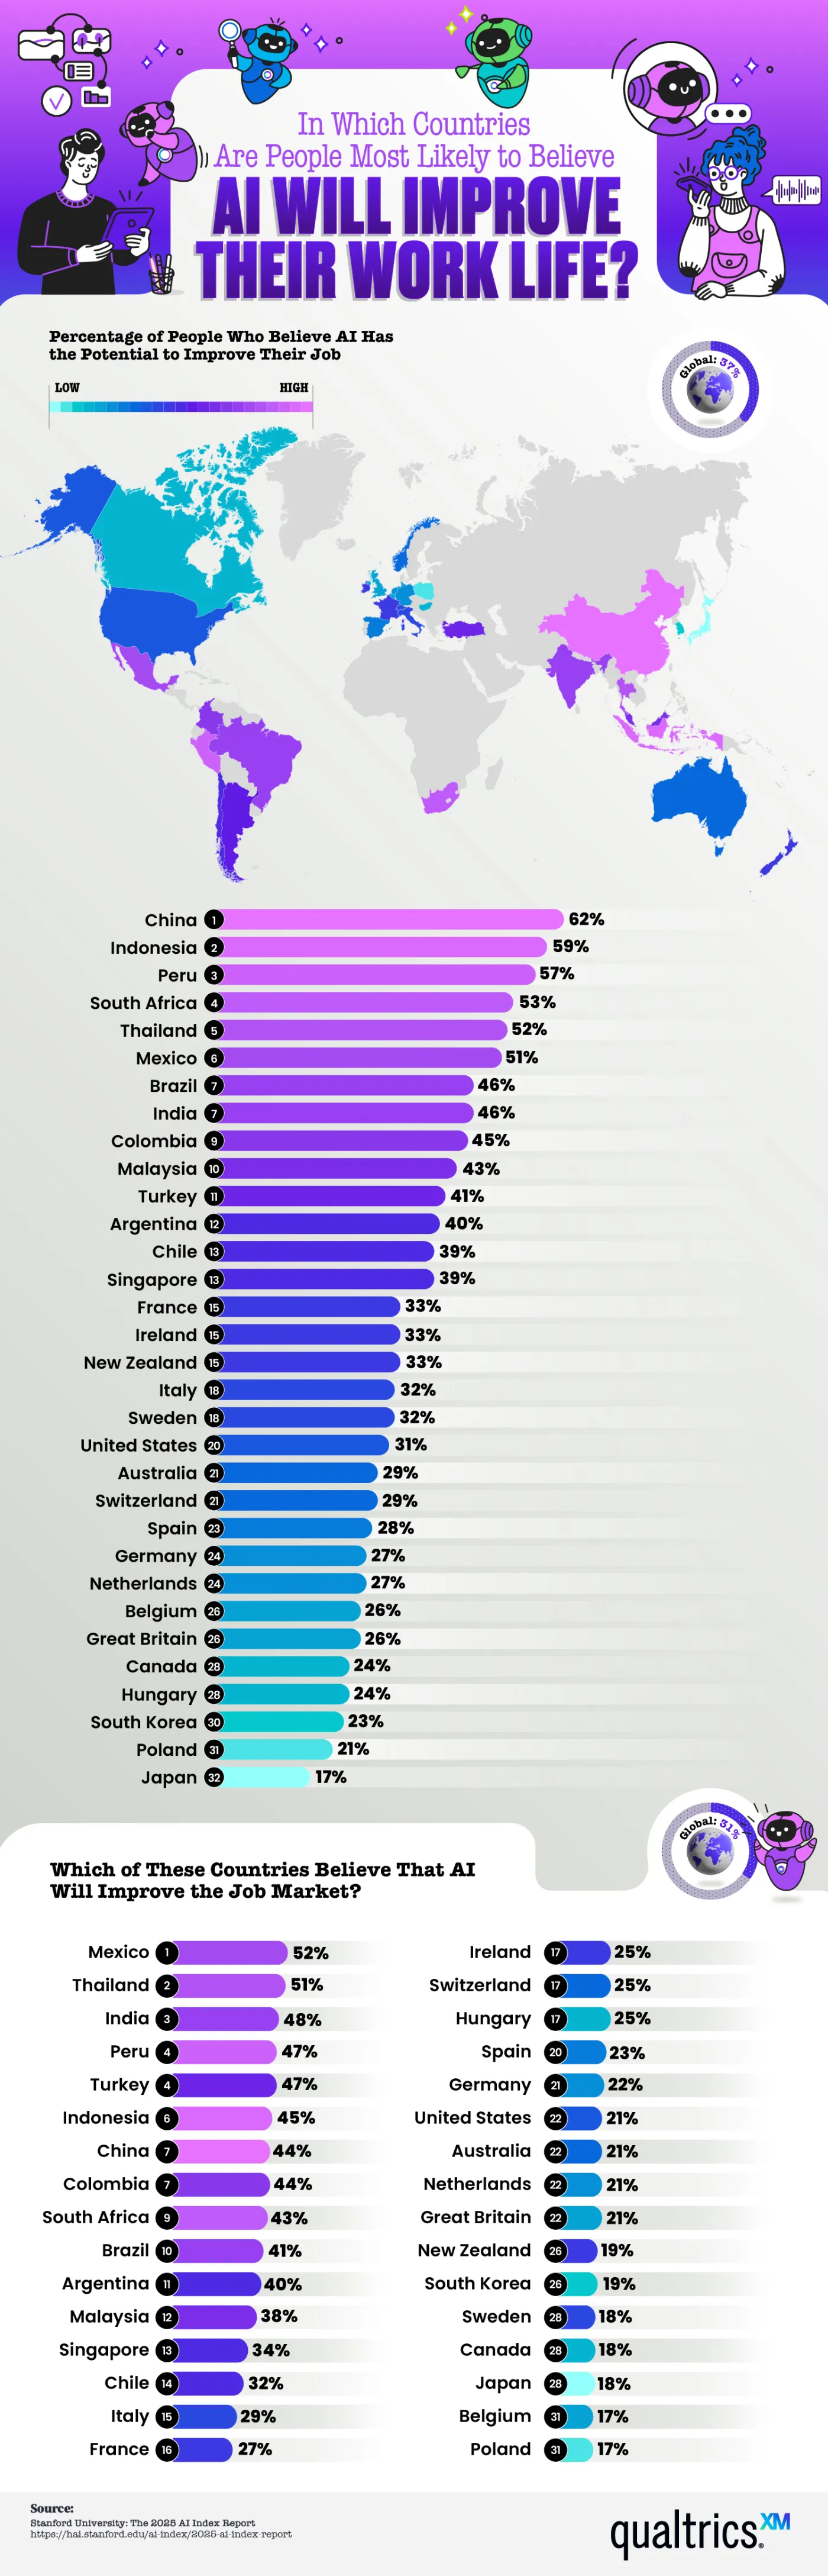
Nearly 80% of global companies report using AI in some capacity, and research indicates productivity gains, with lower-skilled workers benefiting the most. Even if this is the case, employee sentiment isn’t nearly as unified. The numbers the team shows here indicate a healthy level of AI skepticism. In fact, more than half of workers think AI will improve their lives in just 6 out of 32 countries studied. That means there are more skeptics than people excited about what AI will bring to the workplace. But why does optimism cluster in some regions while most remain skeptical?
Here are a few of the countries where optimism runs high:
- China – 62% of workers are optimistic
- Indonesia – 59%
- Peru – 57%
- South Africa – 53%
- Thailand – 52%
There is a mid-tier region with fewer optimistic workers, but still a healthy percentage. This includes Mexico, Brazil, India, Colombia, and Malaysia. Many of these countries have developing economies or a heavy state investment in AI infrastructure, as is the case in China. Workers in these places view AI as a tool to close skill gaps, raise wages, and improve living standards. These regional differences are easy to spot thanks to the map Qualtrics created, which color codes the level of optimism/skepticism.
At the other end of the spectrum, we find the highest number of skeptics in Western Europe and English-speaking countries. Here are the countries with the least faith in AI:
- United States – 31% of workers are optimistic
- Australia – 29%
- Great Britain – 26%
- Canada – 24%
- Japan – 17%
- Poland – 21%
The media narratives in these countries frame AI as a risk of automation-driven job loss, which shapes people’s perceptions even when AI adoption in their workplaces is the same as in optimistic locations. These nations are the same that rank lowest on the belief that AI will improve the job market.
Economic research suggests that AI tends to reshuffle tasks within a role rather than eliminate that job outright. New skills will be required to work with AI, and some positions will shift, but historically, new digital tools have created more roles than they’ve erased. The gap between the hard data and public sentiment in skeptical countries is definitely worth examining and tells a story.
As AI rolls out unevenly across the world’s workforce, it’s important for employers to understand where their employees actually stand on the issue. Beyond regional stereotypes or headline-driven assumptions, employers must look at facts like the data presented here to make thoughtful AI adoption decisions.
Moving consistently ranks among life’s most stressful experiences, behind only divorce and the death of a loved one. This difficulty isn’t even distributed by location. Some cities make a renter’s move dramatically more difficult than others. Rove Lab’s analysis of 55 major U.S. metro areas, scored across 13 factors including population density, rental housing, transportation, and weather, shows which cities make moving a logistical nightmare.
Click below to zoom.
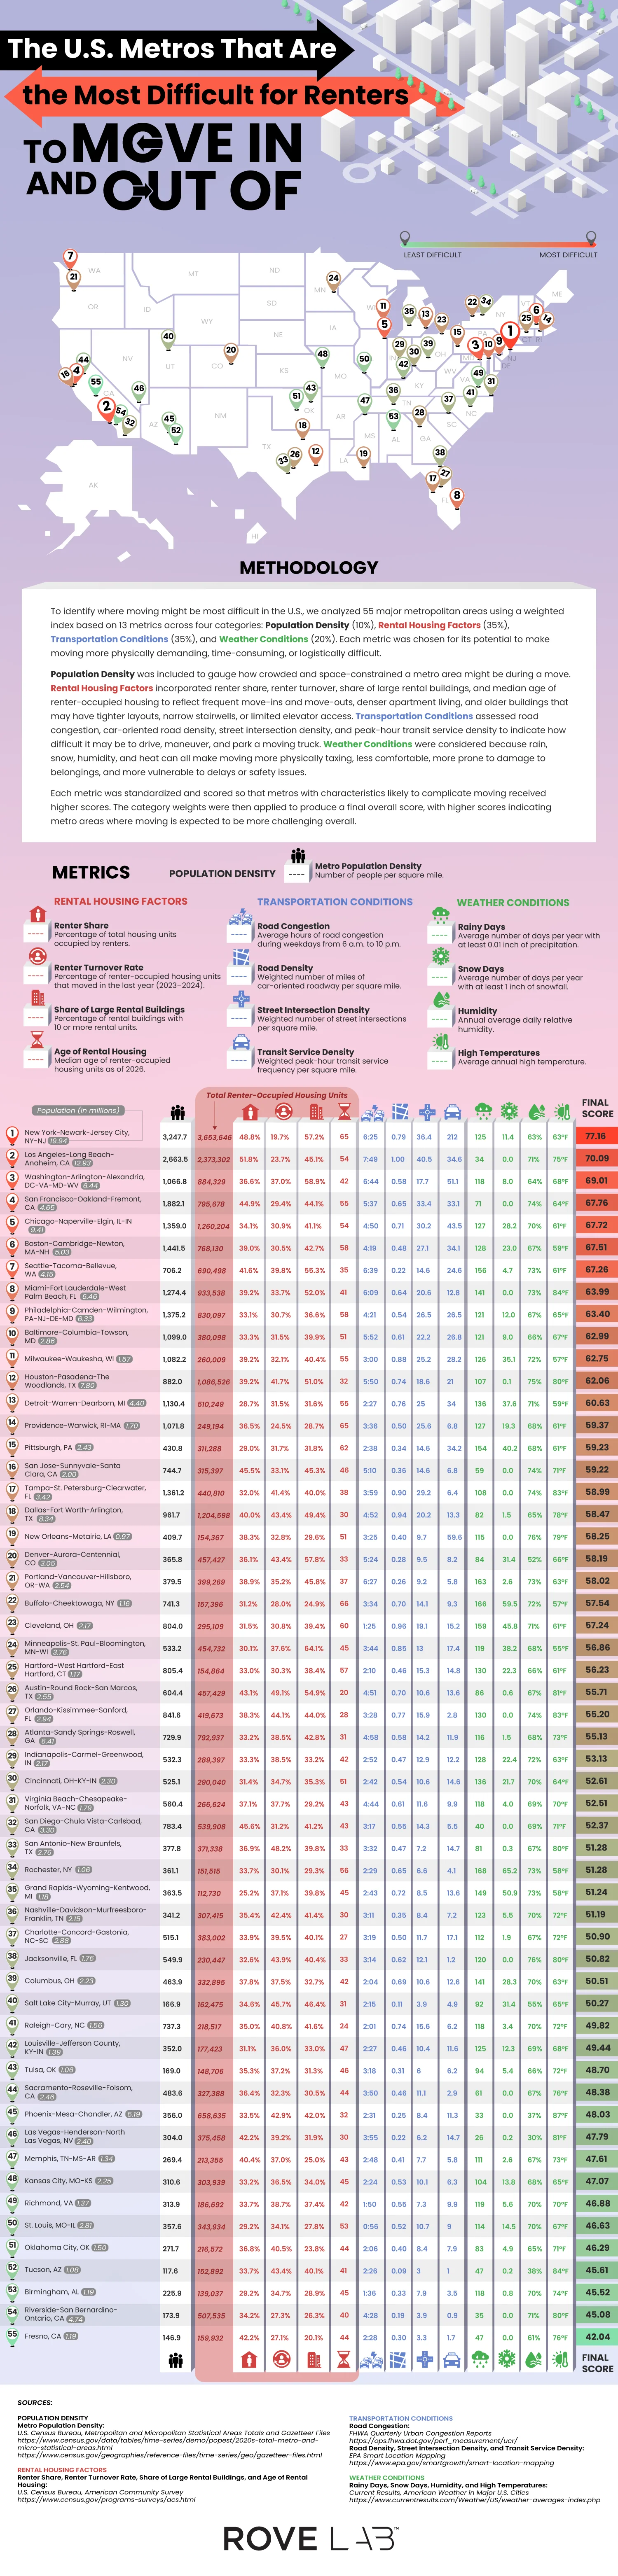
The New York-Newark-Jersey City metro area is the most difficult one to move from, with a score of 77.16. There are several reasons it’s so difficult. For one, it has the highest population density in the country, at 3,247.7 people per square mile. It also has the lowest renter turnover at 19.7%, indicating fierce competition for available units. 57.2% of rental properties are large buildings with more than 10 units, and the median building age is 65. This means these older buildings have narrow stairwells, slow elevators, and tight corners, a nightmare on moving day. On top of this, the transit density at peak hours is 212 vehicles per square mile. Trying to move out of an older building with narrow hallways, busy stairs and elevators, and limited street parking is truly challenging.
Move-in difficulty varies widely by city. Los Angeles isn’t the densest city, but it has the worst traffic congestion in the country, with 7 hours and 49 minutes of traffic per weekday, due to urban sprawl and car dependence in the region. Washington, D.C. has the oldest housing units, making it more challenging to navigate furniture on move-in day, especially in dense transit corridors. San Francisco and Chicago are mid-density metros with older buildings and a high number of large buildings with many units, driving up the scores. Boston and Seattle round out the top of the most difficult cities, thanks to lots of snow in Boston and tons of rainy days in Seattle, which make moving in more difficult.
Thankfully, the team’s data also shows that not every city is a move-in nightmare. Austin is a standout city with the highest renter turnover in the country. A pandemic-era construction boom created an oversupply of new, modern housing units, which led landlords to offer move-in incentives and upgrades. Fresno, Riverside-San Bernardino, and Birmingham all offer easier moves thanks to a low population density, newer rental stock, and less traffic. The weather’s role shouldn’t be overlooked. Rochester, Buffalo, and Pittsburgh all have lots of snowy and rainy days, which can really put a literal and figurative damper on moving day.
The Rove Lab team’s work reframes the question of which cities are best and worst to live in through a specific, practical lens. Your housing is one of the most important parts of your life in a new city, and finding the best rental and having a good move-in experience will set the tone for a new start. Wherever you’re headed, knowing what you’re walking into can help you have the best experience.
When a language disappears, a worldview, history, and culture fade with it. There are thousands of languages at risk of going extinct, as a report from Preply shows. Their Endangered Languages Report gathers data showing where the crises are most acute, while offering hope that extinction isn’t inevitable. They’ve shown areas where revival is working, too. The study highlighted problem areas in vanishing languages, the reasons they are in danger, and hopeful signs that languages can be revived.
Click below to zoom.
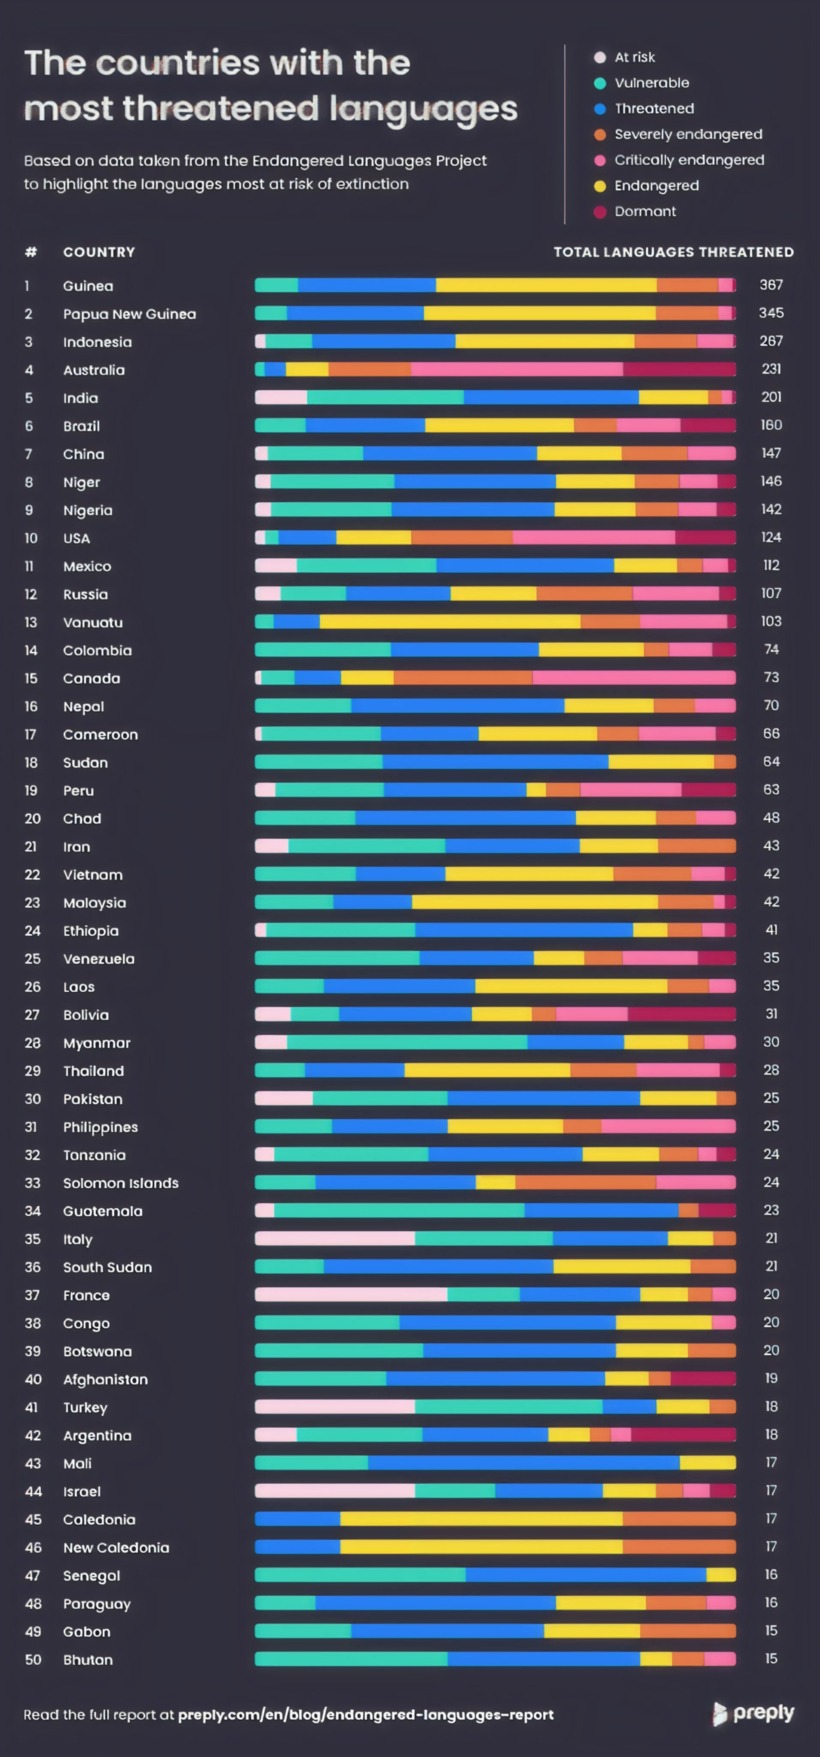
Australia leads the world in the number of critically endangered languages indigenous to its borders (133). In general, the Pacific region and islands have the most endangered languages overall, at 250. Africa has the highest number of threatened languages at 217. In many of these locations, globalization puts pressure on Indigenous and isolated communities. A globalized world pushes young working-age people toward learning a globally dominant language like English or Mandarin, so they have expanded opportunities. It’s worth paying attention to the scale the study creates with at-risk, vulnerable, threatened, endangered, severely endangered, and critically endangered languages. This shows that risk is a spectrum in the world of language, just as it is in plant and animal species.
In the data, a language stands out as a relative success story. Welsh is a vulnerable language, with 19%–20% of the population speaking it. After over 50 years of effort and education, it rose to 30% of children between 3 and 15 years old who spoke it. The nation of Wales set a goal of a million fluent speakers by 2050. If they can meet that goal, it will prove that policy and education can revive a language.
The Lakota language is a cautionary tale of historical oppression. There are only 2,000 speakers today and it’s an endangered language. The United States assimilation policies pushed Indigenous people into residential schools, where children were forced to drop their language and speak English. Today, only 1% of the Lakota population of 170,000 can speak their native language fluently.
Cornish is a rare and unique language brought back from extinction. It officially went extinct in the 1800s, and thanks to a standardized written form revived and adopted in 2008, there are now 557 speakers of a once-dead language.
“Awakening” languages are revivals of once-extinct languages, like Cornish. Kaurna, an Australian language, was nearly lost when the last speaker passed away in 1929. But a program worked to revive it among 50 speakers using dictionaries, songs, and formal education programs. These aren’t the only awakening languages. Wampanoag, Palawa Kani, and Natchez have also awakened back into existence. Revitalization is slow, meticulous work, but these languages show that it’s possible.
Non-native speakers can do their part to support efforts by studying an at-risk language or helping out a revival group. Native speakers carry the heaviest burden and will most effectively save a language by teaching it to their children early. Schools and governments also have a part to play by offering classes in endangered languages. Language survival is possible when ordinary people decide the language is worth speaking.
-

 Business Visualizations2 years ago
Everything Owned by Apple
-

 Business Visualizations2 years ago
America’s Most Valuable Companies Ranked by Profit per Employee
-

 Business Visualizations1 year ago
The Biggest Fortune 500 Company in Every State
-

 Business Visualizations1 year ago
The Biggest Employers by Industry
-

 Timelines2 years ago
Timeline Charts the Development of Communications Technology
-

 Business Visualizations8 months ago
The Largest Companies in America That Are Still Run by the Person Who Founded Them
-

 Maps2 years ago
A Map to Gold and Silver
-

 Charts1 year ago
Map Uncovers Countries with Most Powerful Passports