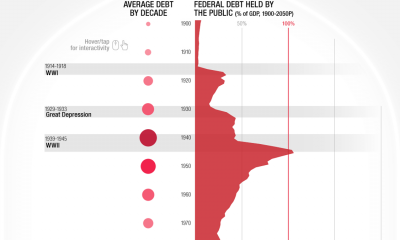

Today, the national debt of the United States of America stands at an eye-watering 28 trillion dollars and rising. The CARES Act of 2020 and other...


The United States is a colossal country with an incredible range of beliefs, livelihoods, and experiences. One thing that unifies the vast majority of America is...
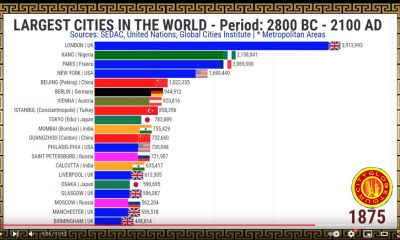

Let’s take a incredible journey through history to see the world’s largest cities over time with this animated visualization. This video, created by CityGlobeTour on YouTube,...
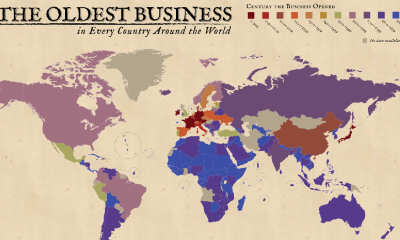

When you think of old businesses, do you think of your grandfather’s barber shop from the 1950’s or that amazing Italian restaurant in the city from...


Here at Chartistry, we are big fans of Star Wars! I personally grew up spending many joyous hours watching the movies and playing the video games...
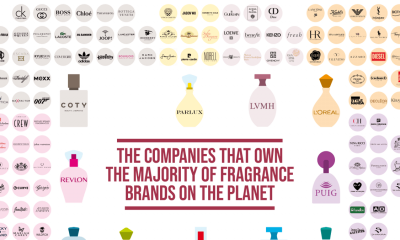

When it comes to certain industries it seems like there are only a handful of corporations that own a majority of the brands that make up...


The Earth has evolved throughout billions of years to become the ground we walk on today. Since the earliest start of organic material 3 billion years...
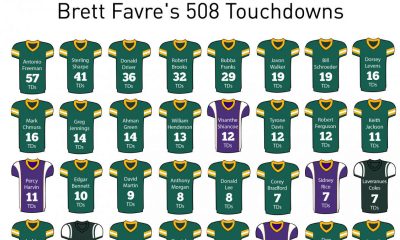

From 1992 through his retirement in 2010, there were very few Quarterbacks who were better than Brett Favre in the NFL. Over the course of his...
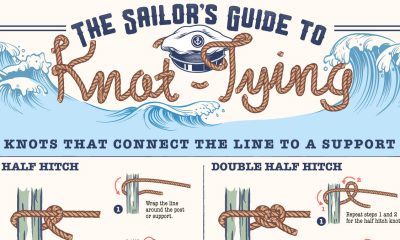

One of the most important skills to learn as a sailor is the art of knot tying. Knots can be used for so many things across...


The Marvel Cinematic Universe (MCU) is one of the most popular and lucrative franchises in the world. It’s the highest-grossing film franchise of all time, and...