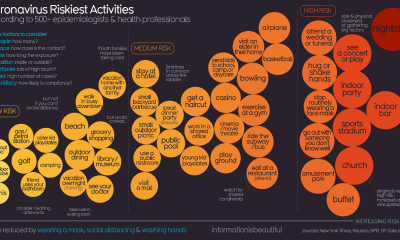

Coronavirus has drastically altered the way we live our lives, do our jobs, celebrate happy events, and mourn our losses. Just last summer, most of us...
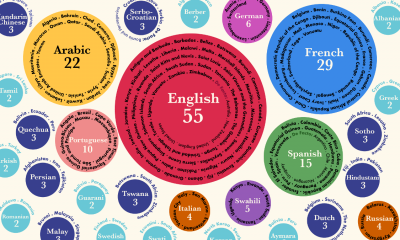

What’s the official language of your home country? From Word.tips, this guide focuses on the official languages that are found in the most countries around the...
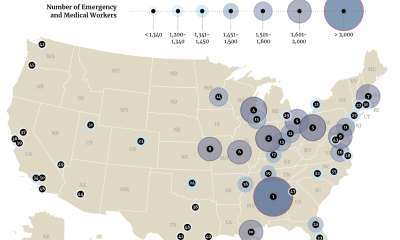

Emergency and medical workers are the lifeblood of the city; registered nurses, police officers, firefighters, primary care doctors, EMTs, and paramedics are all invaluable for keeping...
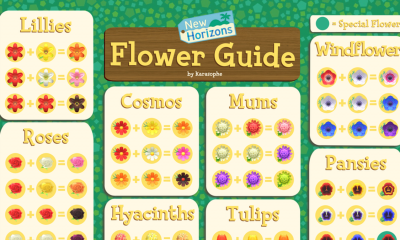

Undoubtedly, one of the most popular video games of 2020 has been Animal Crossing: New Horizons, which was released on the Nintendo Switch back in March....
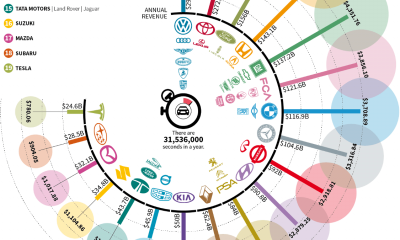

We know that major companies are making a fortune on a daily basis, but how much are they really making when you break it down to...
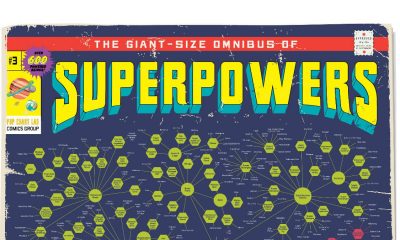

If you could have any superpower, which one would it be? If you ask yourself this question often, then this is the guide for you. The...
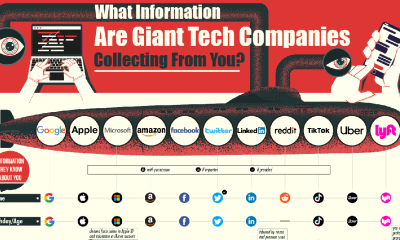

Ownership of personal data has become a hot button topic as of late and people are paying much closer attention to the information that they are...
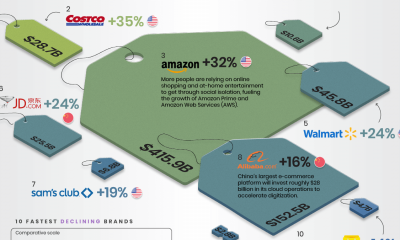

Which retail companies have grown or declined the most in the past year? This proportional area chart from VisualCapitalist uses the size of different “price tags”...
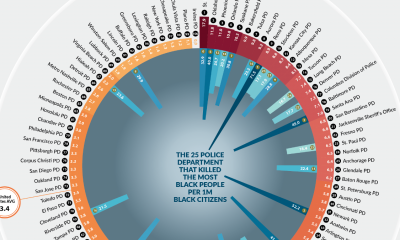

Police brutality cases are a serious topic in the United States right now. Multiple instances of deadly use of force in recent times has reopened the...
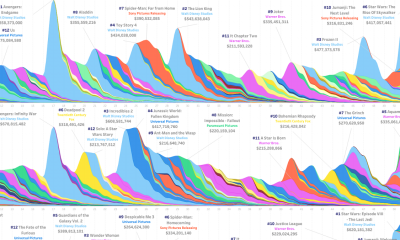

Not only is this visualization by Alex Varlamov incredibly vibrant and captivating, it is packed with juicy knowledge that any movie buff or even casual entertainment...