Misc Visuals
New Safety Checklist Provides Tips to Avoid Vacation Rental Scams
None of us wants to worry about scams, theft, and safety while on vacation, but it’s an unfortunate reality in the world of vacation home rentals. These scams can ruin vacations and have a lasting impact on the lives of victims. The team at Ooma created a helpful checklist of safety tips for travelers to help them avoid vacation rental scams and other dangers abroad. The list offers tips to help you before you arrive, after you check in, and provides awareness of safety by room, as well as general safety and emergency tips.
Click below to zoom.
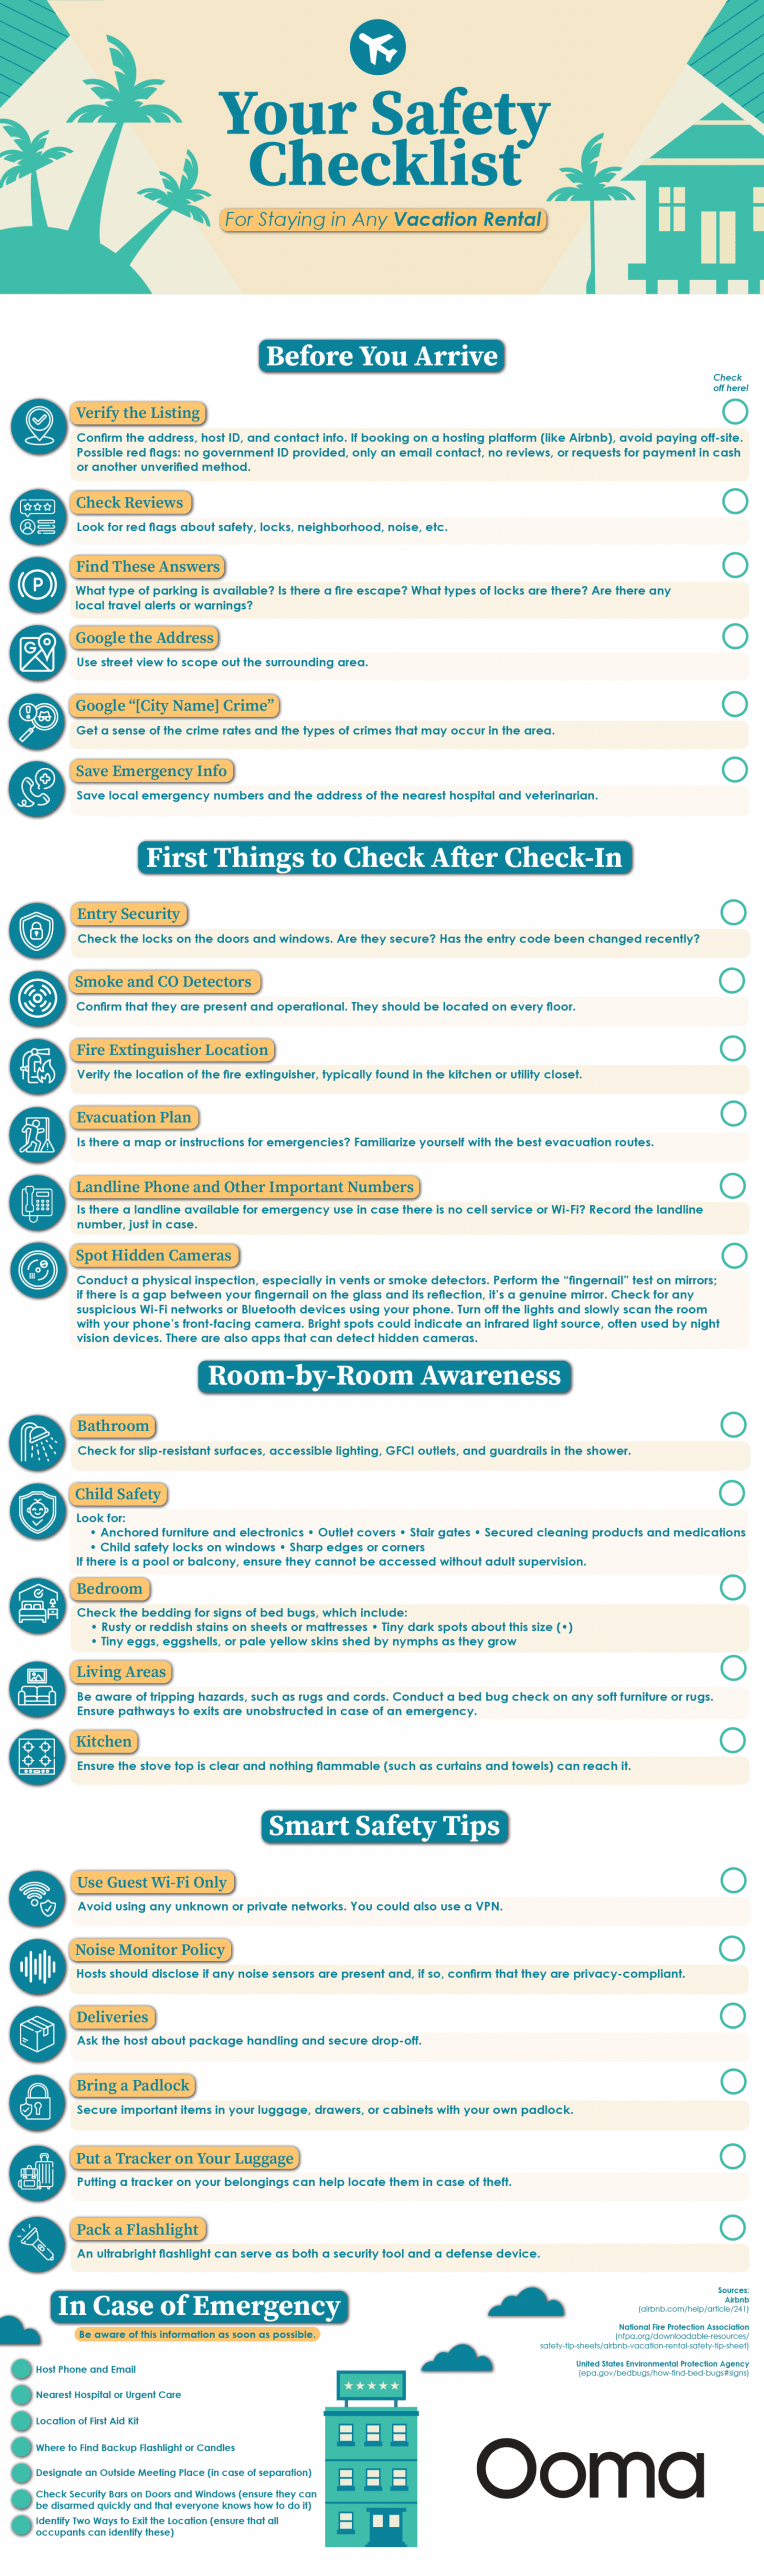
Before booking, vacationers should make sure their rental choice is legitimate. There are many different ways that criminals use rentals to run scams. They’ll post false advertisements that exaggerate the luxuriousness of their rental. In some cases, it might not exist at all. They may also cancel a rental at the last minute without providing a refund. They may also try to convince their renter to switch to a poorly maintained property at the last minute. Other common ways to scam a renter for money are “free Wi-Fi” that steals information and fake menus for food delivery that harvest credit card information.
Once vacationers are aware of these scams, how can they protect themselves against them? Here are some of the tips the Ooma team offers:
- Verify the owner’s area code to make sure it matches the rental location. It’s a good sign if the rental agent offers multiple ways to contact them.
- Beware of any rental agents who try to pressure you to make a decision about renting. Always take your time when booking and be wary of pushy renters.
- Ask the rental owner questions about the local area. This can be a simple question about restaurants and attractions that help prove the person is renting to tourists in good faith.
- Compare the rental pictures with Google Maps Street View images. Exterior images should appear relatively the same and help prove that the rental is located at the listed address.
- Never share your banking information or Social Security number.
- Never pay in cash, wire transfer, or gift cards.
- Ensure your rental agreement includes a refund policy.
- Check the reviews and make sure they’re legitimate. There shouldn’t be too few or too many based on the age of the listing.
The team offers a lot of general tips, too. They advise bringing a flashlight and putting tracker tags on your luggage. Only use private guest networks or a VPN when using the Internet. Check for slip-resistant surfaces and appropriate electrical outlets in the bathrooms. The rental should also have emergency exit routes, fire extinguishers, and smoke detectors. Verify that all doors and windows are properly secured. Platforms like Vrbo and Airbnb require renters to inform all guests about the presence and type of surveillance devices, which can be used to protect you, but shouldn’t infringe upon your privacy. Make sure to check your rental platform’s safety tips and policies as well.
When you visit a mattress store or browse through mattress options online, there are a lot of choices that make us feel like we’re choosing from dozens of options from a wide variety of companies. But this choice is an illusion, as a handful of corporations actually own these brands and control large portions of the mattress and bedding industries. The team at NapLab breaks down ownership of the most recognizable mattress companies. Their work shows us that brand diversity is often a mask for a limited corporate structure.
Click below to zoom.
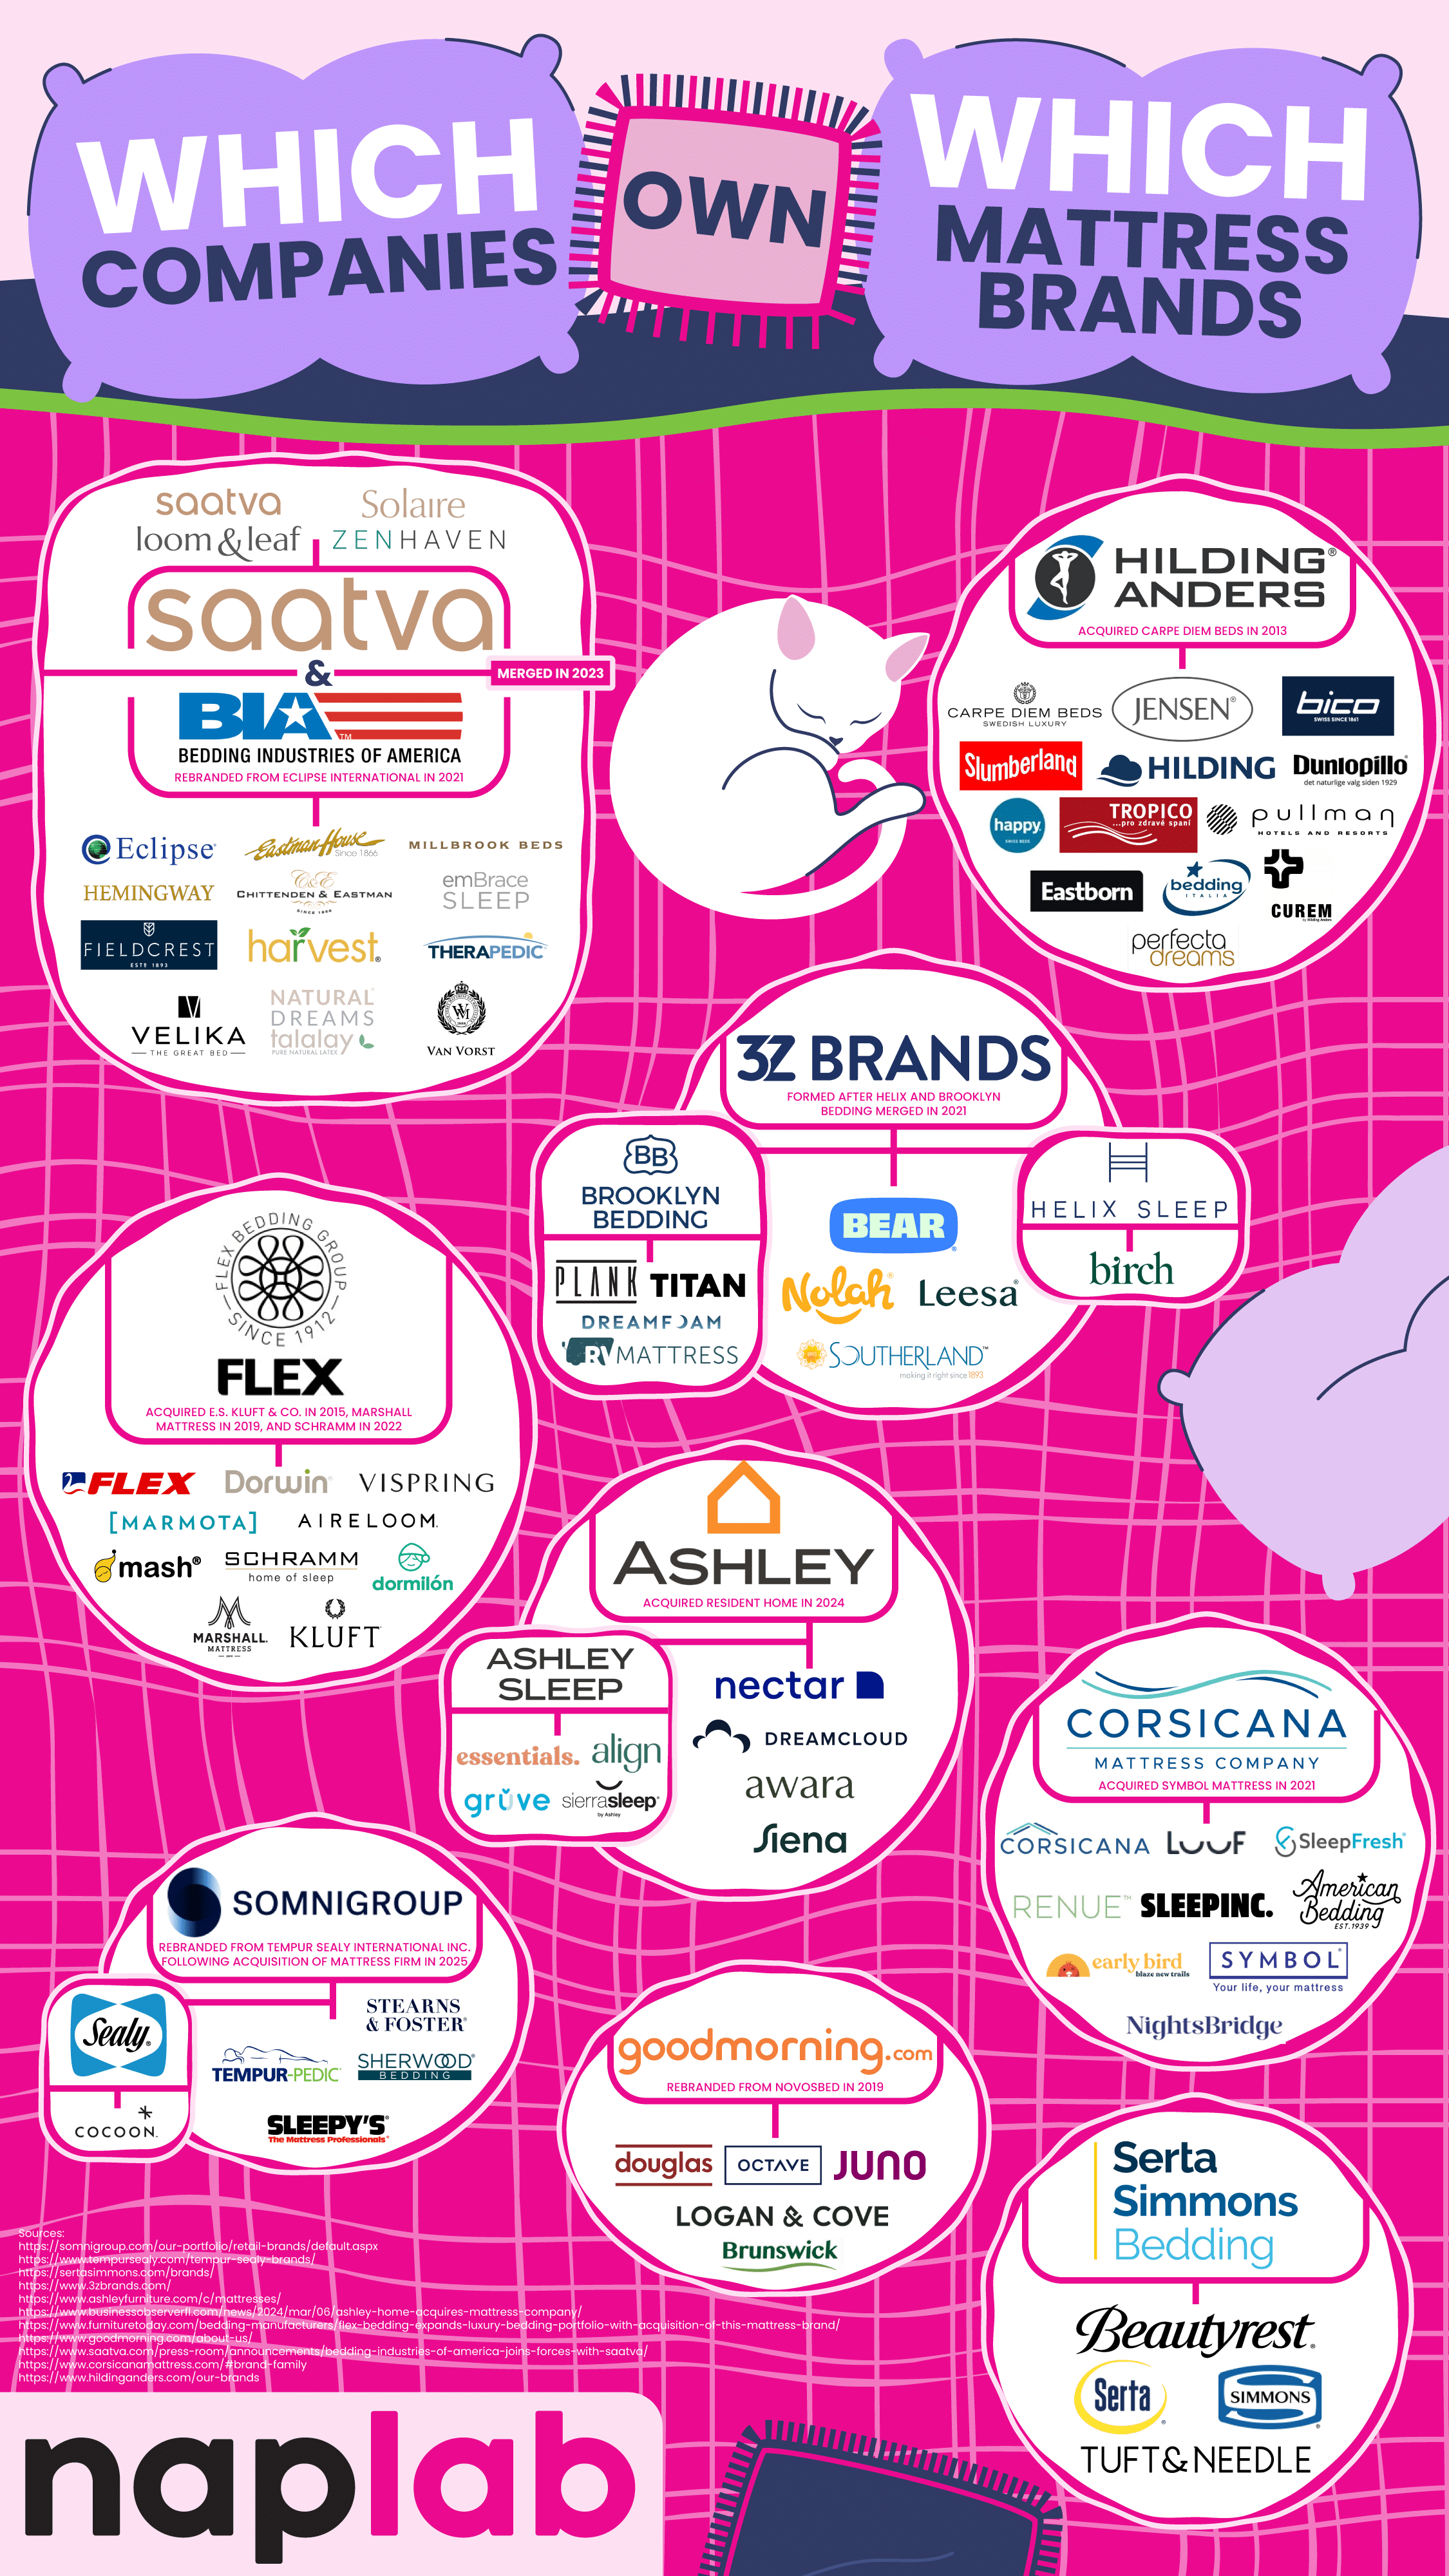
One of the biggest shareholders of the mattress industry is Somnigroup International. They used be called Tempur Sealy International, a name you probably recognize. What you might not realize is that this company owns brands like Tempur-Pedic, Sealy, Stearns & Foster, Sherwood Bedding, and Sleepy’s. They also own the entire extensive Mattress Firm retail store network. This makes Somnigroup International a powerful driving force in mattress sales and distribution.
Another big player in the industry is Serta Simmons Bedding LLC (SSB). They own classic brand names like Simmons, Serta, Beautyrest, and Tuft & Needle. SSB has had its share of financial challenges, including filing for Chapter 11 bankruptcy in 2023, but it still continues to own a significant share of the American mattress market.
Not all these owners are giant manufacturers. Ashley Global Retail is best known for furniture, but it entered the mattress market when it acquired the Resident Home family of brands, which includes Nectar, Awara, Siena, DreamCloud, and Ashley Sleep. These options encompass both luxury and budget-friendly mattress brands.
3Z Brands is a key player in the direct-to-consumer mattress sales space. They own the brands Helix Sleep, Bear, Brooklyn Bedding, Leesa, and Nolah. These brands represent the share of shoppers who prefer buying a mattress online rather than dealing with retailers and sales representatives.
Saatva Inc. used to focus solely on selling luxury mattresses online, but in 2023, it merged with Bedding Industries of America. The merger added other brands to their roster, including Eclipse, Millbrook, Ernest Hemingway, and Eastman House, in addition to Saatva’s name brand of products.
We also see some international companies represented here. GoodMorning.com, formerly known as Novosbed, is a Canadian company that primarily sells to the U.S. market, encompassing the brands Octave, Juno, Douglas, and Logan & Cove.
The Flex Bedding Group is Spanish-owned and sells luxury and niche products to Americans, including the high-end brands Marshall Mattress, E.S. Kluft & Co., Kluft, Aireloom, and Vispring.
Understanding which companies own these mattress brands helps consumers make informed choices. It also helps us understand that brands might appear vastly different, but in reality, they’re under the same corporate umbrella, which influences everything from pricing to marketing to manufacturing.
This brand consolidation isn’t any different from many other industries, like beer and skincare, but it does raise consumer concerns about true choice and industry competition.
A new article from Ooma examines the facts surrounding Americans’ decision to abandon cable television and landline phones in favor of Internet-based and wireless alternatives. This study illustrates a changing landscape in how people connect with one another and consume media. The piece includes a colorful list of 30 key statistics that illustrate the technological revolutions and cultural shifts shaping the world of communications and entertainment.
Click below to zoom.
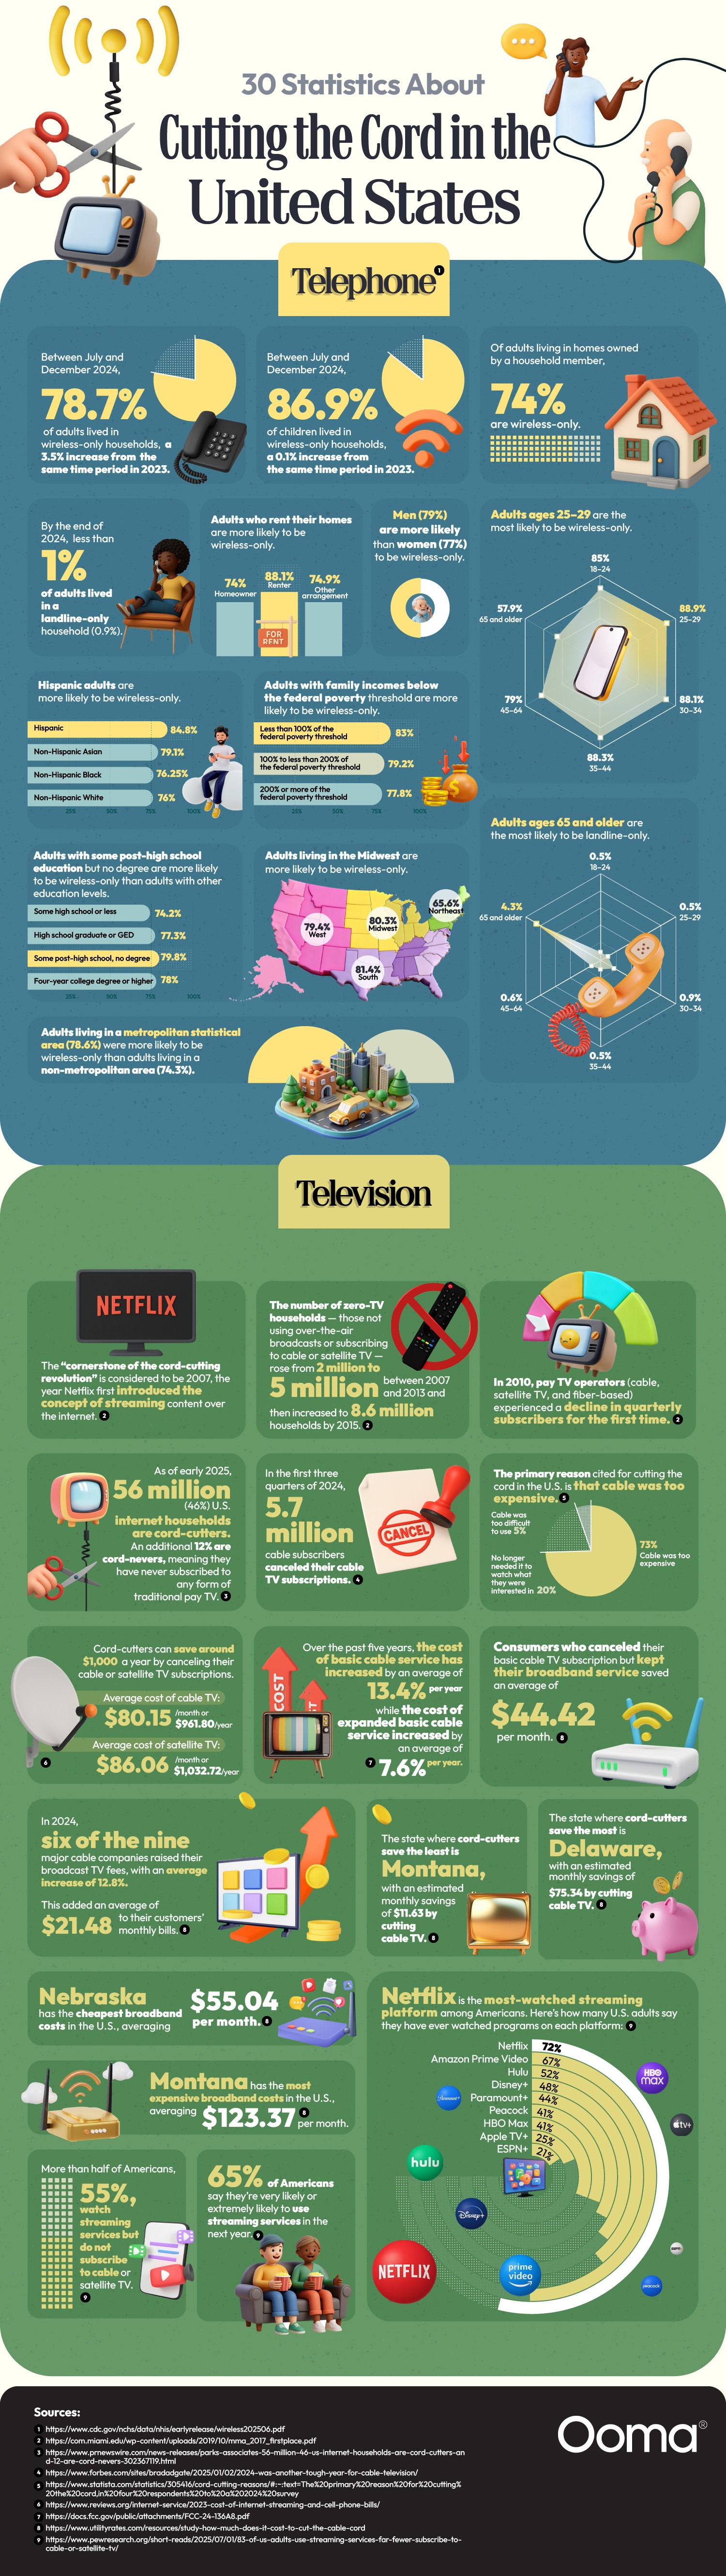
One of the most striking findings is the decline in landline phones. These were once a staple found in nearly every American home, but landlines are disappearing. By the end of 2024, only 1% of adults had a landline in their home. That’s 78.7% of adults and 86.9% of children living in a wireless-only household. They have cut the telephone cord and rely on cell service and Internet-based calls.
The article provides evidence that traditional cable TV is in trouble as well. As of 2025, 56 million households, or 45%, had cut the cord, meaning they no longer use cable, satellite, or traditional paid TV services. An additional 12% of American households are “cord-nevers,” meaning they’ve never had these services to begin with. That means over half of Americans don’t use cable.
Swaths of users are cutting the cable cord. 5.7 million cable subscribers canceled their TV services in 2024. Their main motivator was the cost of cable. 73% of cord-cutters said cable is too expensive to continue. Six of the nine major cable companies have increased their broadcast fees by 12.8% on average, which adds around $21.48 to monthly bills. Cord-cutters save about $1,000 each year by canceling cable and satellite services and sticking with broadband.
So, what replaced these cable services? Over half of Americans say they watch streaming services. 65% of these users say they’re very likely to continue using streaming services next year. The top streamer is Netflix. 72% of Americans say they’ve watched Netflix content, followed by Amazon Prime Video at 67%, then Hulu at 52%. Industry data reports that streaming surpassed cable and broadcast viewership in 2025.
This shift isn’t isolated to Ooma’s data alone. According to Nielsen’s media consumption report, streaming services accounted for 44.8% of total U.S. television usage. This surpassed combined broadcast and cable television viewing for the first time in 2025, clearly marking a definitive shift in viewer preferences toward digital platforms.
Taken together, these statistics show a clear trend toward Americans valuing the flexibility, cost savings, and on-demand access of streaming over traditional cable and communication systems. Landlines and cable are on their way to becoming relics of the past, replaced by modern wireless services and Internet streaming that better fit modern budgets and lifestyles. Advancing technology and better broadband access will likely continue to shape how households connect, entertain themselves, and make decisions about spending on phones and entertainment.
Deciding which home improvement projects are worth your time and money can yield big payoffs. Whether you think you’ll sell yourself soon or want to increase your comfort and value, you can use this new study from Ace Handyman Services to decide which projects to tackle. Their article “Which Handyman Home Improvement Projects have the Biggest ROI?” pinpoints the upgrades and repairs that will give you the greatest return on investment.
Click below to zoom.
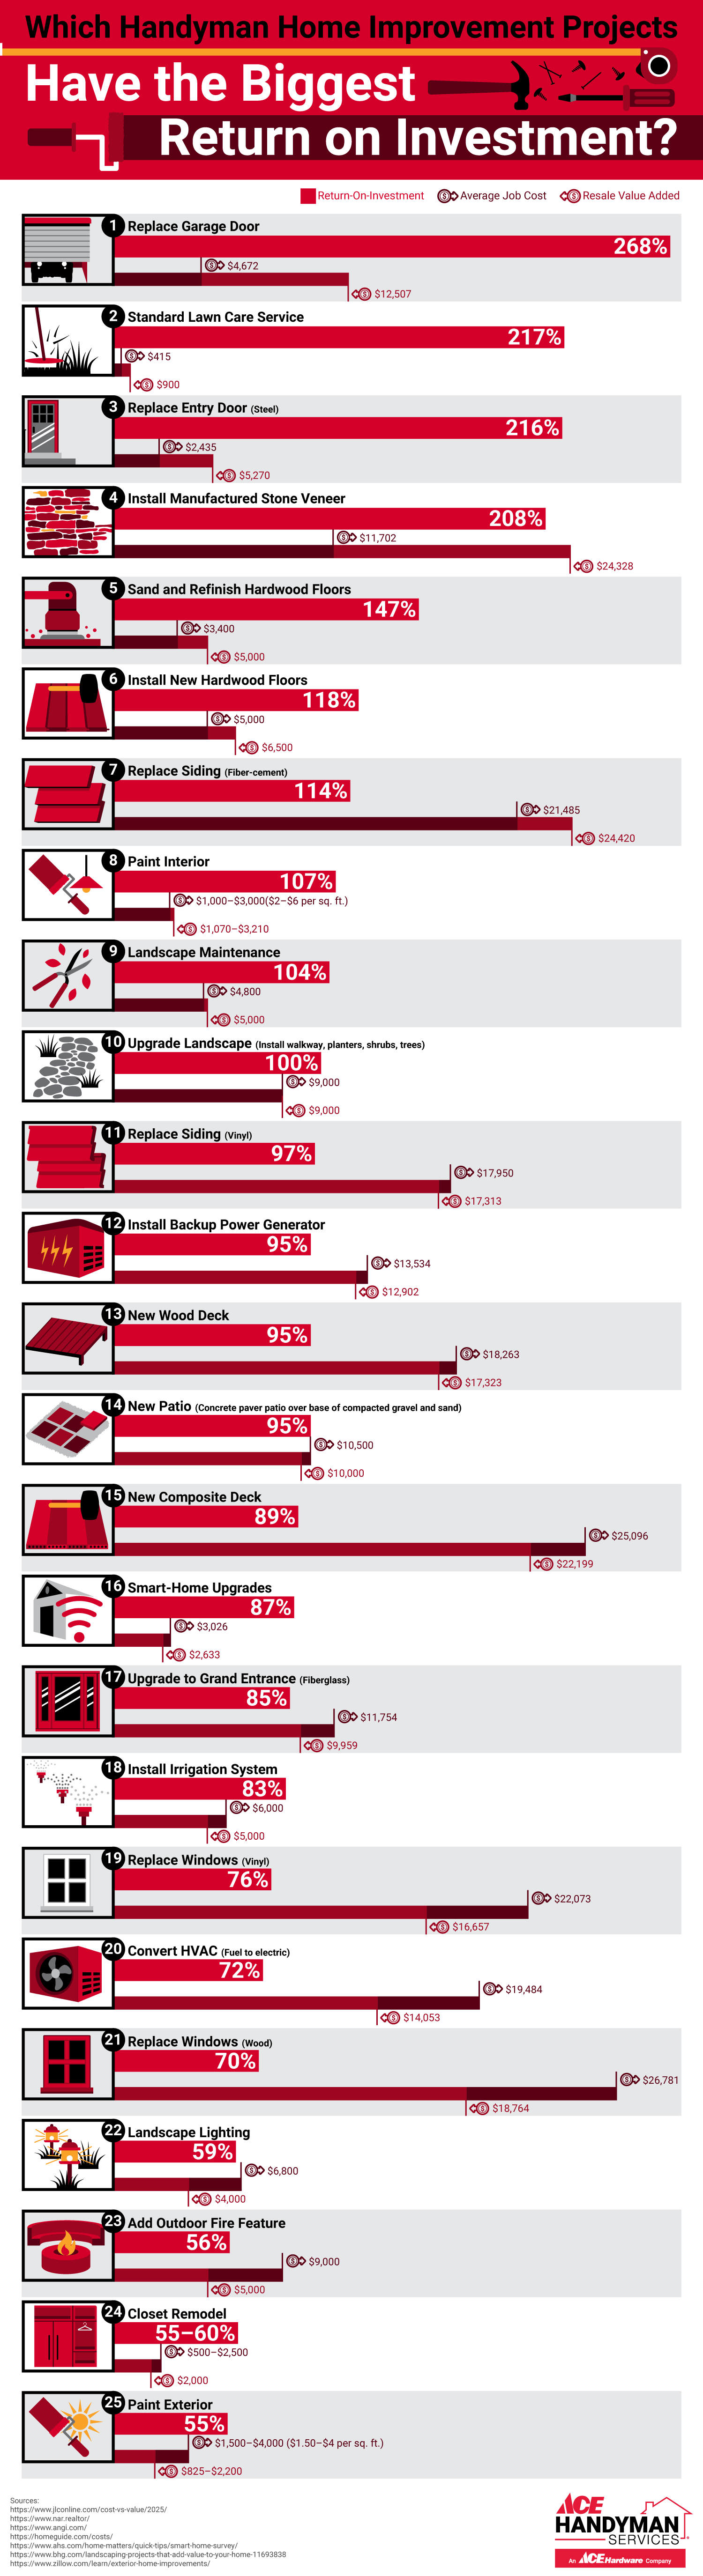
The study focuses on cost-effective projects that offer a tangible increase in home value. These projects will improve the home’s functionality and make it look more cared for. Both qualities are appealing to potential buyers. Some of the top upgrades the team lists are garage door replacement, new entry doors, refinishing floors, fixing siding, and painting the walls. Landscaping and proper lawn care also go a long way toward increasing curb appeal. Nationwide surveys show that simple cosmetic upgrades can add over 100% of the project’s cost to the home’s value. This is particularly true if you paint in neutral or modern colors.
Experts also point to kitchen and bathroom improvements as good, modest cost investments. Replacing fixtures and cabinets can make a big difference. National data points to small-scale kitchen remodels recouping 80% to 96% of their costs, which is a much better ROI than big, expensive remodeling overhauls. We see in the team’s data that flooring and exterior upgrades also have a major impact. Well-maintained and upgraded floors are often worth more than the cost to do the project. New hardwood floors or sanding and refinishing floors add around $5,000 of resale value. A lawn care service has an enormous ROI of 217%, underscoring the massive impact of curb appeal. Upgraded landscaping can add $9,000 in value, and even simple landscape lighting can add around $4,000. You could also consider adding an outdoor fire feature, which would add $5,000 in value.
Overall, these projects had the highest ROI:
- Replacing the garage door
- Standard lawn care service
- Replace the entry door
- Install manufactured stone veneer
- Sand and refinish hardwood floors
- Install new hardwood floors
- Replace siding
- Paint interior
- Landscape maintenance
- Upgrade the landscape
The biggest message the team’s study underscores is that handyman projects can outperform big remodels and renovations in terms of increased home value. These handyman-friendly projects that the average DIYer can achieve represent a balance of cost-effectiveness, value impact, and everyday comfort enhancement. Always lean toward adding visual appeal and increasing functionality when deciding on ways to improve your home. The projects on this list will help you make a more beautiful, comfortable home without breaking your back. Whether you hire a handyman service or take on the project yourself, these projects are within your grasp and will give you a solid return on the investment.
-

 Business Visualizations1 year ago
Everything Owned by Apple
-

 Business Visualizations1 year ago
America’s Most Valuable Companies Ranked by Profit per Employee
-

 Business Visualizations11 months ago
The Biggest Fortune 500 Company in Every State
-

 Business Visualizations9 months ago
The Biggest Employers by Industry
-

 Business Visualizations2 years ago
New Animated Map Shows Airbnb’s Fully Booked Cities Along the 2024 Eclipse Path of Totality
-

 Business Visualizations2 years ago
Everything the Luxury Giant LVMH Owns in One Chart
-
 Business Visualizations2 years ago
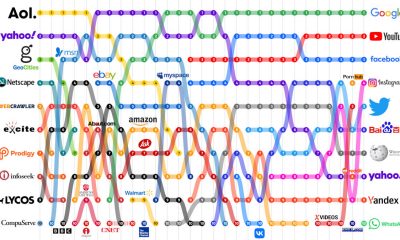
Timeline Shows the Top 10 Most-Visited Websites Each Year Since 1995
-

 Timelines1 year ago
Timeline Charts the Development of Communications Technology