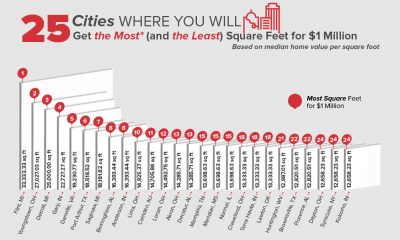

The COVID-19 pandemic has disrupted the entire world, including the stock market. Some business’s saw massive gains while others have faced bankruptcy. The housing market did...
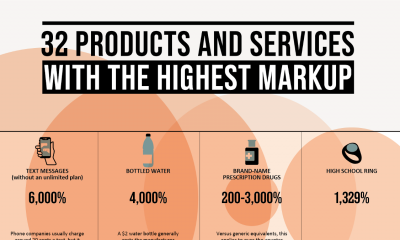

Society has been trained not to blink an eye when paying two bucks for a bottle of water, or shelling out ten dollars for a bucket...
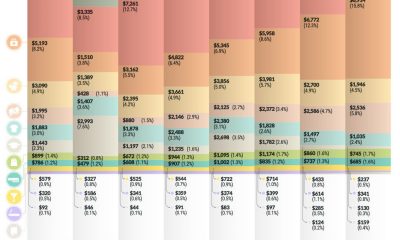

Have you ever wondered how your spending habits compare to that of the average American? Or to others in your age group? Then check out this...
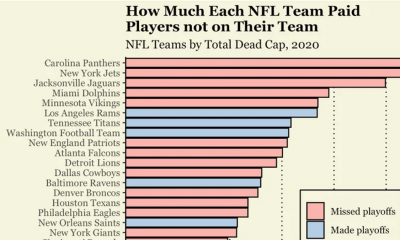

In the National Football League, the good teams are good for a reason, and the bad teams usually stay bad. We’re approaching one of the most...
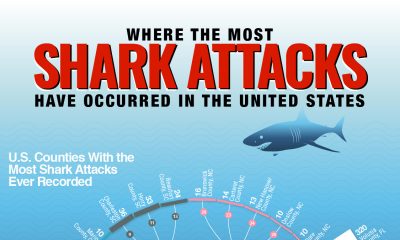

It may not come as a surprise, but Florida is the “shark attack capital of the world.” Since 1837, there have been 868 reported shark attacks...
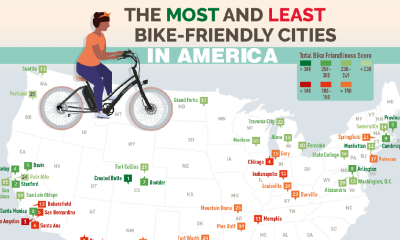

Cycling is becoming an increasingly popular activity in America, especially during the pandemic when so many are stuck at home. Bike sales soared in 2020 as...
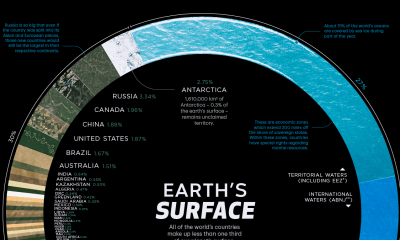

The total surface area of the Earth is about 197 million square miles. Only about 29% of that area is land; which means the vast majority...


Even though the series finale of popular American TV show Friends aired more than 16 years ago, the show still has a fan base of both...
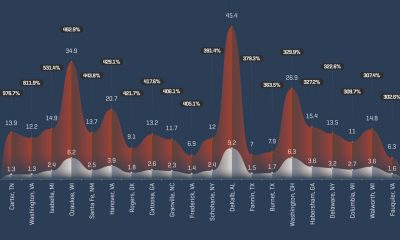

Racial disparities within criminal justice have been at the forefront of the news recently. Between cases of police brutality and incarcerations for low-level drug crimes, the...


This interactive data visualization is perfect for dog and cat lovers. Why Do Cats & Dogs?, created by Nadieh Bremer in partnership with Google Trends, analyzed...