Chartistry
  • Home
  • Business Visualizations
  • Finance Visualizations
  • Real Estate Visualizations
  • Chartistry Originals
  • Visualizations by Type
    • Charts
    • Maps
    • Timelines
    • Videos
    • Interactives
    • Misc Visuals
Chartistry Chartistry

Chartistry

  • Home
  • Business Visualizations
    • Study Examines the Logo Rebrands That Led to Big Increases in Web Traffic

    • Find the Places in the U.S. Where People Are Most Eager to Find a Job

    • Research Uncovers the Industries with the Highest Turnover Rates in the U.S.

    • Chart Tracks E-Commerce Brands with the Biggest Gains and Losses

    • Map Displays Unemployment Rates Around the World

  • Finance Visualizations
    • Timeline Helps Us Understand the Resurgence of the “Dumb Phone”

    • Chart Tracks E-Commerce Brands with the Biggest Gains and Losses

    • The Most Expensive U.S. States to Own a Car

    • Where in the U.S. Are Different Tech Sectors Growing the Fastest?

    • A timeline of the most groundbreaking point of sale advancements in history

      Timeline Showcasing the Remarkable History of How We Pay

  • Real Estate Visualizations
    • Study Examines the Best Cities for Raising Kids

    • Study Examines Where Renters Can and Cannot Afford to Buy Their Homes

    • Seven Layers of Vacation Rental Safety

    • Study Identifies the Best Cities for First-Time Real Estate Investors

    • Study Highlights Disparity Between Homelessness Rates and Empty Housing

  • Chartistry Originals
    • The Largest Companies in America That Are Still Run by the Person Who Founded Them

    • The Biggest Employers by Industry

    • biggest-fortune-500-company-state-chartistry-thumb

      The Biggest Fortune 500 Company in Every State

    • companies-ranked-by-profit-per-employee-5_thumb

      America’s Most Valuable Companies Ranked by Profit per Employee

    • everything-owned-by-apple_thumb

      Everything Owned by Apple

  • Visualizations by Type
    • Charts
      • Report Examines Languages on the Way to Extinction

      • Study Examines the Logo Rebrands That Led to Big Increases in Web Traffic

      • Find the Places in the U.S. Where People Are Most Eager to Find a Job

      • Timeline Helps Us Understand the Resurgence of the “Dumb Phone”

      • Research Uncovers the Industries with the Highest Turnover Rates in the U.S.

    • Maps
      • Find the Places in the U.S. Where People Are Most Eager to Find a Job

      • Study Shows Worldwide Opinions on AI Use

      • Map Displays Unemployment Rates Around the World

      • Which States Cause the Most Damage to Your Car?

      • These States Have Been The Fastest to Adopt AI in the Workplace

    • Timelines
      • Timeline Helps Us Understand the Resurgence of the “Dumb Phone”

      • A timeline of the most groundbreaking point of sale advancements in history

        Timeline Showcasing the Remarkable History of How We Pay

      • Exploring Technology That Revolutionized Industries

      • Advances in office technology and the upgrades that replaced them

        Timeline Charts the Advances in Office Technology

      • Study Shows Three Decades of Self-Employment Trends

    • Videos
      • eclipse-totality-airbnb-map-chartistry-cover-image

        New Animated Map Shows Airbnb’s Fully Booked Cities Along the 2024 Eclipse Path of Totality

      • nuclear-warhead-video-timeline-chartistry-thumb-2

        Animated Timeline Shows Nuclear Warheads by Country Over Time

      • big-mac-prices-chartistry-thumb

        How the Price of a Big Mac Has Changed Around the World (2000-2022)

      • largest-cities-world-chartistry-thumb

        The 20 Largest Cities in the World from 2800 BC to 2100 AD

      • smartphone-market-chartistry-thumb

        How Dramatically the Smartphone Market Has Changed Since 2010

    • Interactives
      • Misc Visuals
        • Report Examines Languages on the Way to Extinction

        • Preply Presents a Language and Career Mobility Report for 2026

        • Discover the Movies Best for English Language Learning

        • Key Takeaways from Preply’s Global Language Report

        • Which Brands Have the Best Loyalty Programs?

    • 80-jobs-pay-50k-no-degree-chartistry-thumb 80-jobs-pay-50k-no-degree-chartistry-thumb
      Finance Visualizations5 years ago

      New Chart Shows 80 Jobs That Pay $50,000+ And Don’t Require a Degree

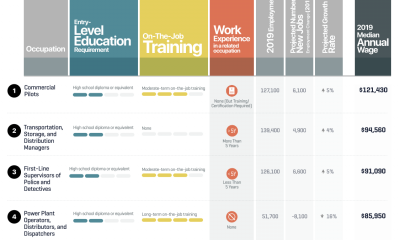
      Student debt is a massive issue in the United States – by the end of 2020, student debt broke a staggering record of $1.7 trillion. That...

    • most-expensive-sports-stadiums-ever-chartistry-thumb most-expensive-sports-stadiums-ever-chartistry-thumb
      Finance Visualizations5 years ago

      A Look at the Most Expensive Sports Stadiums Ever Built

      SoFi Stadium in California, home of the Los Angeles Rams and Los Angeles Chargers, made headlines in 2020 when it was officially opened. With a construction...

    • square-footage-for-1-million-chartistry-thumb square-footage-for-1-million-chartistry-thumb
      Finance Visualizations6 years ago

      How Big of a House Can You Get for $1M Around the United States?

      A million dollars is a million dollars, right? Well, it turns out that a million dollars can go a lot further in some U.S. cities than...

    • Business Visualizations6 years ago

      How Much Car Manufacturers Make Every Second

      We know that major companies are making a fortune on a daily basis, but how much are they really making when you break it down to...

    More Posts
    Page 7 of 71234567


    Advertisement

     
    Advertisement
    Chartistry
    • Home
    • Charts
    • Maps
    • Timelines
    • Videos
    • Interactives
    • Misc Visuals
    • All Data Visualizations
    • The Chartistry Team

    Copyright © 2020-2025 The Chartistry, TheChartistry.com