Misc Visuals
What Every Patch and Insignia Means on a U.S. Military Uniform
Military uniforms in the United States are as recognizable as they are iconic. Whether it’s in films such as Top Gun Maverick, television shows like M.A.S.H., video games like Call of Duty, or in real life, Americans are exposed to U.S. military uniforms on a regular basis. Most often represented is the active duty combat uniform which is officially called the battle dress uniform or BDU. This camouflaged uniform is complete with a series of patches indicating the identity of the soldier, the branch the soldier is enlisted in, their rank and so much more. What do all of those patches and pins mean? Luckily, the folks at Wizard Pins have created this ultimate visual guide to what every patch you might find on a military uniform means.
Click below to zoom
Differences between military patches on Army, Marine Corps, Navy, Air Force, Coast Guard, and even the newly formed Space Force are surprisingly similar. Differences appear to be largely thematic between each military branch. For example, rank patches on U.S. Air Force uniforms resemble wings. Other patches are reserved for those belonging to special divisions, units, and those who have special skills. The visual does an exceptional job of explaining what each patch signifies and where they can be found.
On combat uniforms, rank patches are intentionally modest in appearance to prevent enemy combatants from being able to easily identify leadership from a distance. U.S. Army uniforms, U.S. Marine Corps uniforms, U.S. Navy uniforms, U.S. Coast Guard uniforms, U.S. Air Force uniforms, and U.S. Space Force uniforms may have subtle differences, but they are all uniforms representing one of the largest military forces on the planet.
Mother language is our first language. In a multilingual world, it holds a special place in the hearts of many. The team at Preply surveyed thousands of multilingual speakers to discover what their mother language means to them. Their results reveal that the mother language has a powerful connection to the speaker, even though people have varied relationships with it. The team examined the emotions surrounding mother language, how it affects multilingual identity, memory, migration, and the process of passing it on to children. Preply surveyed over 3,000 people in six countries across generations to offer us a deep look into the nature of mother language.
Click below to zoom.
The team found that many respondents feel that their mother language connects them to who they are. 77% of respondents said their native language is a core part of their identity. They also reported feeling close to people who speak their mother language and that they feel more grounded, more deeply themselves when they speak in their native tongue. This supports research that suggests a person’s first language carries deep personal meaning.
Since language has deep roots in many people’s identities, it can evoke strong emotions. The team’s survey included questions about how native language made the speakers feel. The most popular response was comfort, a feeling shared by 29% of respondents. 23% said their mother language made them feel a sense of cultural identity and 20% said it made them feel proud. Nearly all responses were positive, with the exception of 3% feeling indifferent about their native language and 8% feeling negative emotions about it. The survey found that older generations experienced deeper feelings of cultural identity through language than younger respondents did.
In today’s world, multilingualism is common. UNESCO reports that over half of the world’s population uses more than one language in their daily lives. That means some people have multiple native languages, so how does this affect their feelings about them? The team explored the question. 75% of people claimed to feel equally connected to more than one native language. This pattern shifts when asked to compare native language to second languages. 66% of people feel most themselves when using their native language. Half of the respondents said they use their native language when thinking or talking to themselves. Four in ten reported using the local language of the country they live in, suggesting that language adaptation has an internal component too.
Click below to zoom.
Many people use their native language as a connection within the family unit, too. 85% of immigrants with children said it was important to them that their children speak their native language as well as the local one. Half of the respondents worried that their children would lose a connection to their native culture if they couldn’t speak the language. About 75% of immigrants across surveyed countries said they speak their native language with their children. This was most common in the United Kingdom and Japan.
The Preply surveys provide a clear picture of how mother languages shape family life, identity, and emotional well-being.
A new article from RoveLab presents a data-driven exploration of home-life habits in the United States, examining how much time Americans spend at home and how that changes across each state. Drawing on data from the American Time Use Survey and the Integrated Public Use Microdata Series, the study constructs a ranking of states based on how much time residents spend at home. This data combined at-home activity levels with remote work prevalence.
RoveLab situates its analysis within broader behavioral shifts in the American lifestyle. On average, Americans spend around 18 hours per day at home (including sleep), which reflects a gradual decline in time spent outside the home over the past two decades. This trend pre-dates the COVID-19 pandemic, which spiked time spent at home and prompted the rise of remote work.
Click below to zoom.
Other important facts on time spent at home add more context:
- 80% of Americans engage in daily household activities like cleaning, cooking, and home maintenance.
- 94% of Americans participate in leisure activities at home, including gaming, socializing, and exercise.
- Most Americans watch about 3.57 hours of television daily, which is more than the average amount of daily time spent on household tasks.
These statistics show that a home is the central site of both productivity and leisure, underscoring the growing connection between work and private life.
To determine which state residents are the most homelife-centric, the researchers developed a scoring system that incorporated:
- Average percentage of the day spent at home
- Average daily minutes spent at home
- Percentage of residents working remotely
- Weighted ranking emphasizing time-use data slightly more than remote work numbers
This multi-factor approach shows the team’s effort to balance behavioral statistics with labor trends, offering a comprehensive view of domestic time use.
The team found that residents in these states spend the most time at home:
- New Jersey: 5% of the day is spent at home (1,1495 minutes) and 27.1% of residents work remotely.
- Oregon: 79% of the day is spent at home and 29.3% of residents work remotely.
- Maine: 79% of the day is spent at home and 23.5% of residents work remotely.
New Jersey’s lead position is due to several structural factors, such as its proximity to major employment centers and a highly educated workforce, with over 40% of residents holding a bachelor’s degree. These factors create a population ideal for telecommuting. It shows us that socioeconomic factors can shape our daily routines.
At the low end of the scoring, Wyoming ranks as the state where people spend the least amount of time at home. This reflects a low rate of remote work. Montana relies on industries like agriculture, mining, and tourism, which all require in-person workers. The team also speculates that Wyoming’s emphasis on outdoor recreation leads residents to both work and play outside their homes.
By combining time-use data with employment patterns, the study provides valuable insight into how regional differences, evolving job requirements, and leisure habits shape modern American life.
While aging can bring positive life changes, such as retirement and the freedom to spend more time on hobbies, travel, and visiting family, it also presents unique challenges. Ooma presents a safety guide for seniors, highlighting 30 tips to help them age safely, stay connected, and maintain independence. Instead of a simple list of helpful gadgets, the team created a roadmap to help seniors navigate a rapidly changing world with confidence.
Click below to zoom.
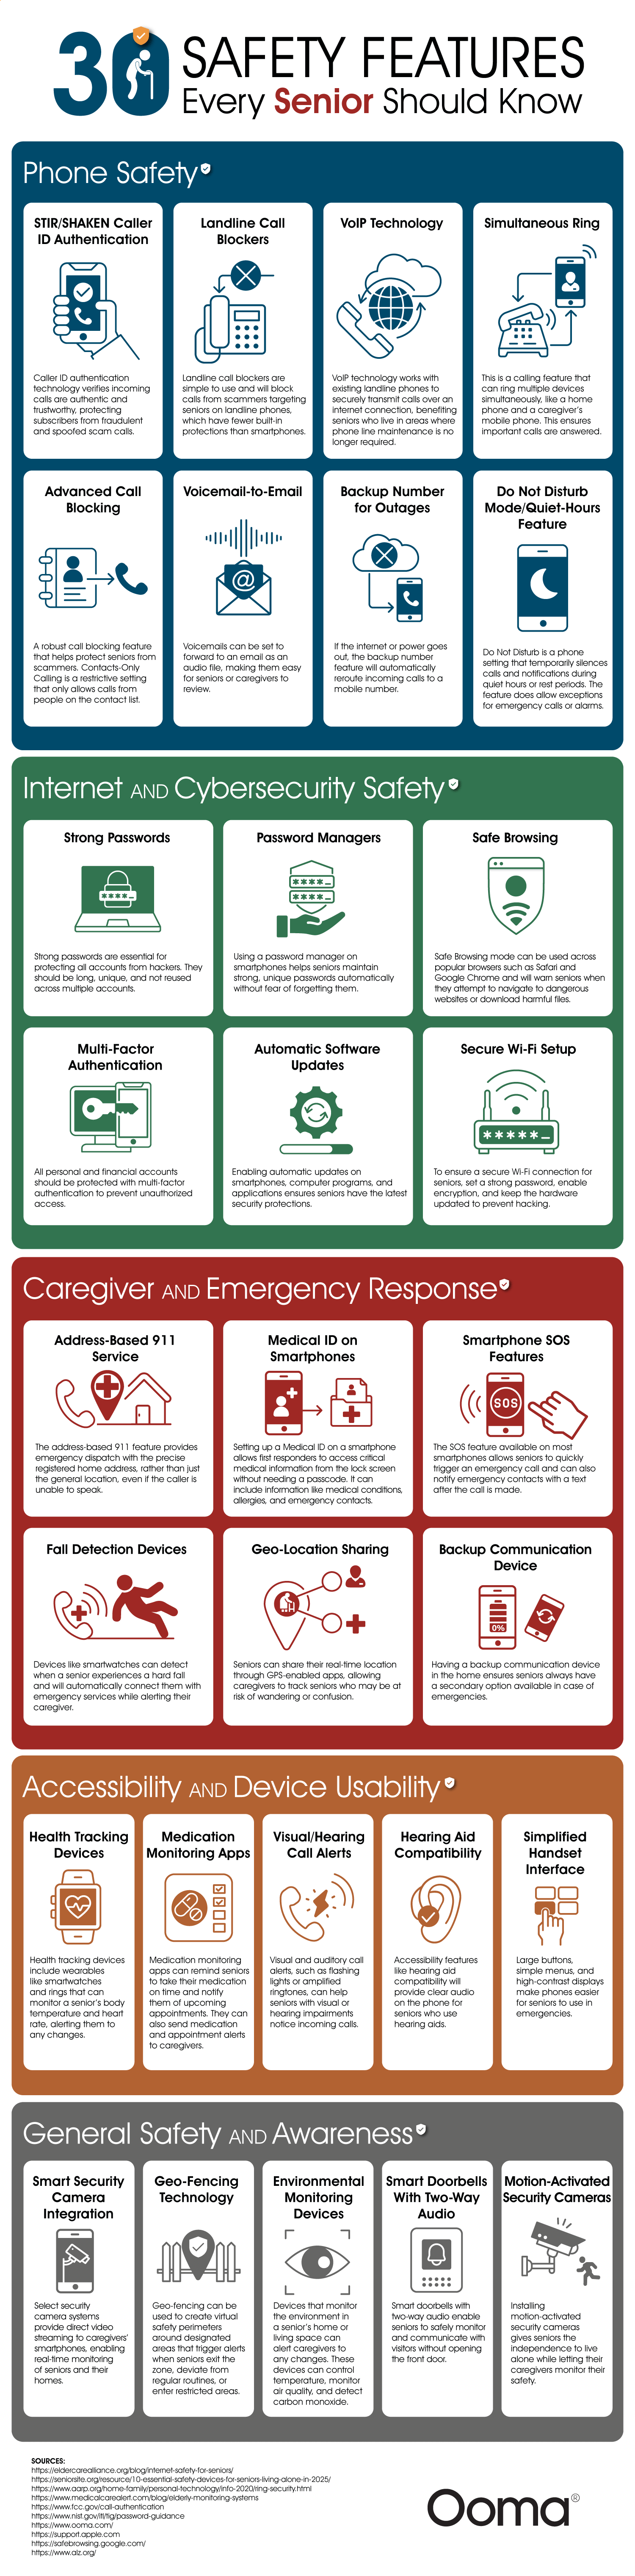
One of the most crucial sections focuses on digital safety and online scam protection. Seniors can use the Internet to learn new things and connect with others, but it’s also full of risks and schemes where criminals prey on uninformed elders. The article explains how to avoid scams with password managers and multi-factor authentication. These tips on strong password creation and extra protection can drastically lower the risk of identity theft and financial loss due to scams.
The following section focuses on physical safety and emergency response. While most of us know to call “911” in an emergency, many of us are unaware of Enhanced 911 (E911), which automatically sends a senior’s address to responders. This is critical if the senior who placed the emergency call cannot speak. A medical ID displayed on a smartphone lock screen can help EMS workers begin treatment instantly and save more lives. Fall detection devices make good use of these services by automatically sharing location and calling for help. These affordable, simple tools can save a senior’s life.
Next, the chart moves on to home security. Smart security cameras and motion-activated systems don’t have to be complicated. They can help seniors reduce stress and increase their peace of mind. Smart doorbells and two-way audio allow them to communicate with visitors without having to go to the door. Environmental monitoring devices are essential for detecting poor air quality and dangerous temperature conditions. Practical advice and the article’s compassionate tone remind readers that safety offers seniors independence.
In that same spirit of independence, the article turns to accessibility. These include visual/hearing alerts, simpler phone interfaces, and medication reminder apps. These tools address health issues that affect all seniors, like hearing loss, vision changes, and memory challenges. These apps and aids will help seniors develop healthy daily routines, reduce frustration, navigate the world, and make the most of their lives.
Lastly, the guide addresses phone safety and scam calls. Seniors can use caller ID authentication and call blocking to reduce fraudulent calls. Unfortunately, seniors are often victims of these scams. While education is also essential for helping seniors navigate these calls, modern VoIP technology and other features make the process much easier. A caller’s sense of urgency can sway them, so these tools can help them avoid the calls altogether.
The team’s tips empower seniors and their loved ones, helping them prepare for the future. This list is a conversation starter to help families plan for independent seniors to live safely and healthily.
-

 Business Visualizations1 year ago
Everything Owned by Apple
-

 Business Visualizations1 year ago
America’s Most Valuable Companies Ranked by Profit per Employee
-

 Business Visualizations12 months ago
The Biggest Fortune 500 Company in Every State
-

 Business Visualizations9 months ago
The Biggest Employers by Industry
-

 Business Visualizations2 years ago
New Animated Map Shows Airbnb’s Fully Booked Cities Along the 2024 Eclipse Path of Totality
-

 Business Visualizations2 years ago
Everything the Luxury Giant LVMH Owns in One Chart
-

 Timelines1 year ago
Timeline Charts the Development of Communications Technology
-

 Charts2 years ago
How Many Crayola Crayon Colors Are There? A Lot.