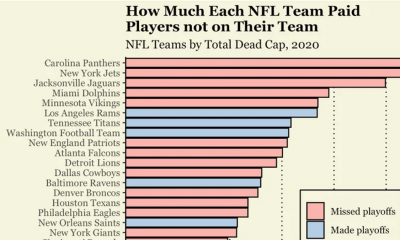

In the National Football League, the good teams are good for a reason, and the bad teams usually stay bad. We’re approaching one of the most...
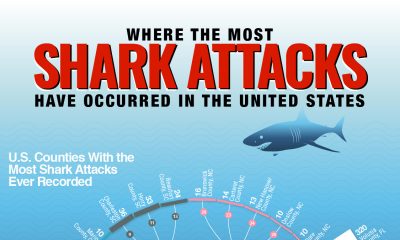

It may not come as a surprise, but Florida is the “shark attack capital of the world.” Since 1837, there have been 868 reported shark attacks...
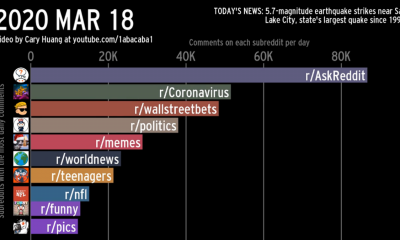

At any specific date in time, trending Reddit subs can provide a snapshot to what users are thinking, searching and talking about. Sports, politics, gaming, current...
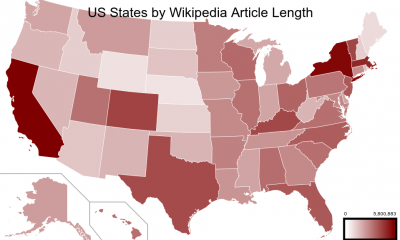

The Data Is Beautiful Subreddit has long been a favorite stomping ground of the staff here at The Chartistry. In fact, it was beautiful data visualizations...

Racial disparities within criminal justice have been at the forefront of the news recently. Between cases of police brutality and incarcerations for low-level drug crimes, the...
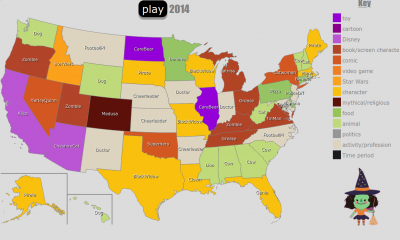

What is America dressing up as for Halloween this year? How about for the past 6 years? This animated thematic map, created by DATABAYOU, shows what...
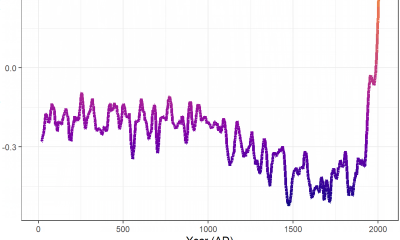

Today’s animation comes to us from Reddit user /u/bgregory98 and visualizes global temperature trends from 0 to 2019 AD, the results are eye-opening: Across the 2,000-year...


The Marvel Cinematic Universe is the most beloved superhero film franchise ever conceived and the four-film Avengers Infinity Saga is easily its crowning achievement. With Avengers:...
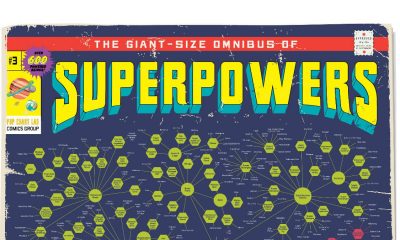

If you could have any superpower, which one would it be? If you ask yourself this question often, then this is the guide for you. The...
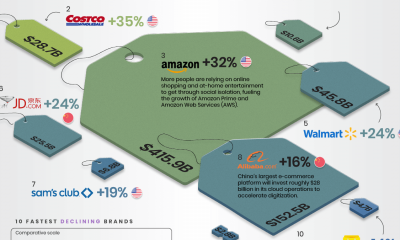

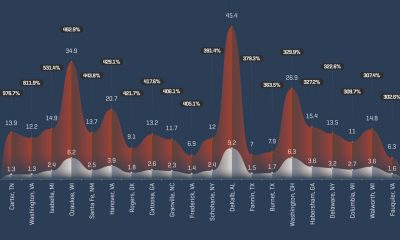
Which retail companies have grown or declined the most in the past year? This proportional area chart from VisualCapitalist uses the size of different “price tags”...