
The COVID-19 pandemic has disrupted the entire world, including the stock market. Some business’s saw massive gains while others have faced bankruptcy. The housing market did...
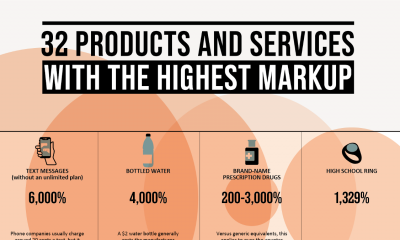

Society has been trained not to blink an eye when paying two bucks for a bottle of water, or shelling out ten dollars for a bucket...
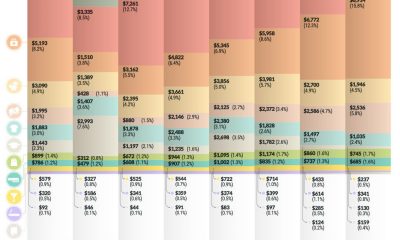

Have you ever wondered how your spending habits compare to that of the average American? Or to others in your age group? Then check out this...
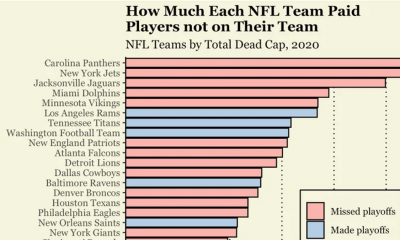

In the National Football League, the good teams are good for a reason, and the bad teams usually stay bad. We’re approaching one of the most...

Student debt is a massive issue in the United States – by the end of 2020, student debt broke a staggering record of $1.7 trillion. That...


SoFi Stadium in California, home of the Los Angeles Rams and Los Angeles Chargers, made headlines in 2020 when it was officially opened. With a construction...
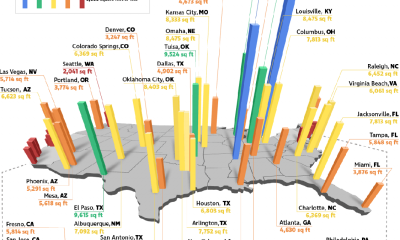

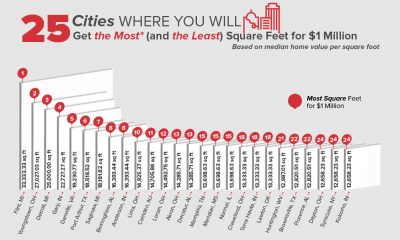
A million dollars is a million dollars, right? Well, it turns out that a million dollars can go a lot further in some U.S. cities than...
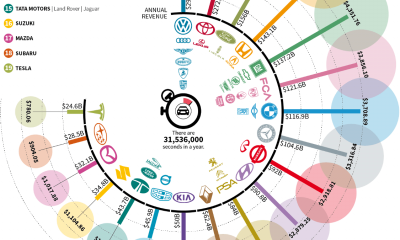

We know that major companies are making a fortune on a daily basis, but how much are they really making when you break it down to...