
The Data Is Beautiful Subreddit has long been a favorite stomping ground of the staff here at The Chartistry. In fact, it was beautiful data visualizations...

Racial disparities within criminal justice have been at the forefront of the news recently. Between cases of police brutality and incarcerations for low-level drug crimes, the...
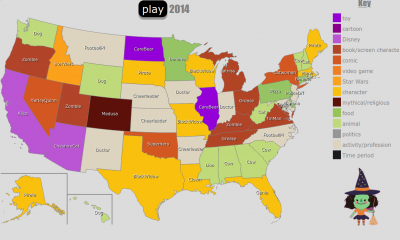

What is America dressing up as for Halloween this year? How about for the past 6 years? This animated thematic map, created by DATABAYOU, shows what...
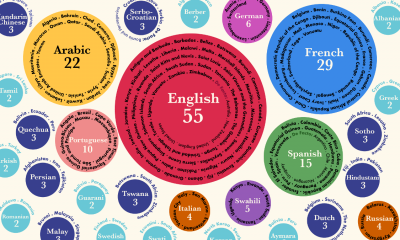

What’s the official language of your home country? From Word.tips, this guide focuses on the official languages that are found in the most countries around the...
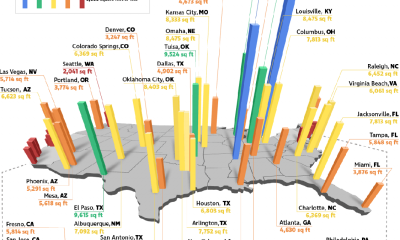

A million dollars is a million dollars, right? Well, it turns out that a million dollars can go a lot further in some U.S. cities than...
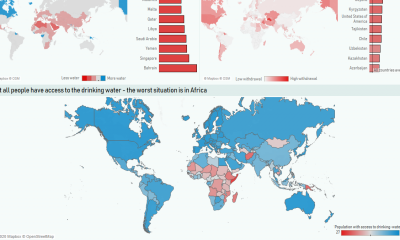

As the human race expands it is also depleting natural resources at an alarming rate. The entire planet has less than 1 percent of freshwater available...
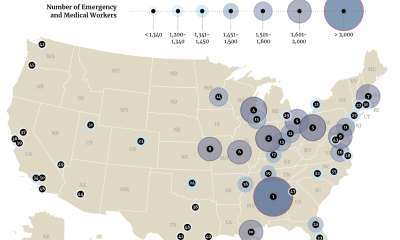

Emergency and medical workers are the lifeblood of the city; registered nurses, police officers, firefighters, primary care doctors, EMTs, and paramedics are all invaluable for keeping...
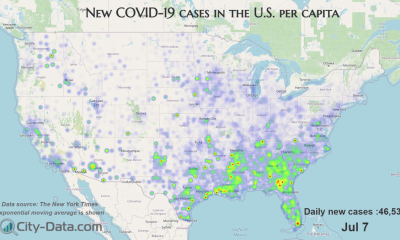

Today’s new animated heatmap comes to us from City-Data.com and follows the trends of new confirmed coronavirus cases around the United States over time. The animation...
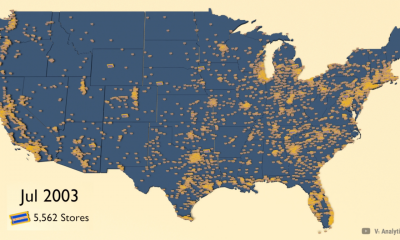

The rise of major streaming services such as Netflix and online retailers such as Amazon have had a devastating impact on once-booming American classic retail establishments...
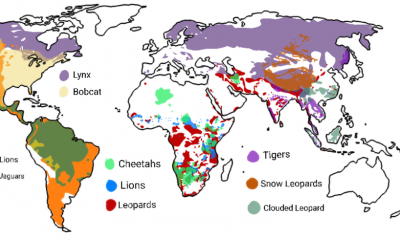

Hey all you cool cats and kittens! Have you ever wondered where in the world big cats can be found? Aside from Joe Exotic’s animal park...