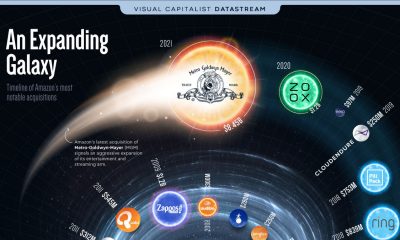

Ecommerce giant, Amazon, began as a small online book reseller in 1994 and has grown into one of the largest corporations in the world. The company...

Many Americans have ambitions of opening their own business. From restaurants to clothing boutiques, small businesses are one of the hallmarks of the American dream. People...
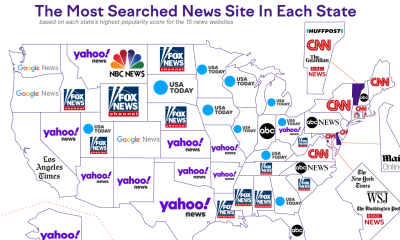

Fake news has become a hot-button issue in recent years, with many questioning where they and others are getting their news from. So, where is everyone...
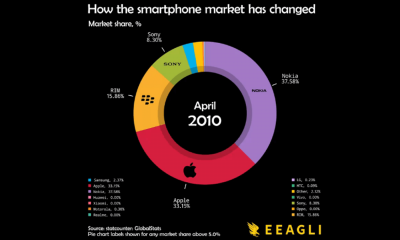

I remember my first cell phone. It was an orange Nokia, the thing felt like a brick, and I’m pretty sure it was indestructible. I wish...
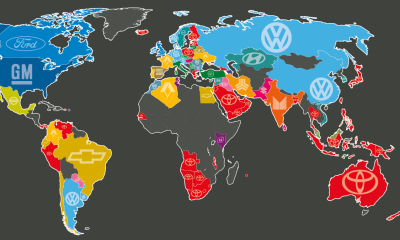

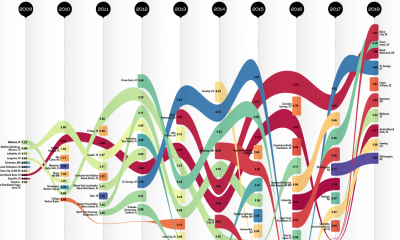
Car brand popularity varies in different countries around the world. What’s most popular in one location may be completely unavailable in another. Have you ever wondered...
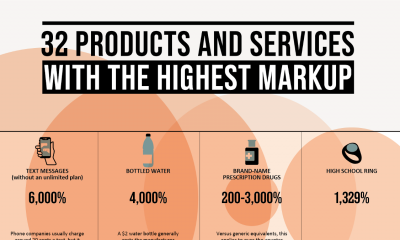

Society has been trained not to blink an eye when paying two bucks for a bottle of water, or shelling out ten dollars for a bucket...
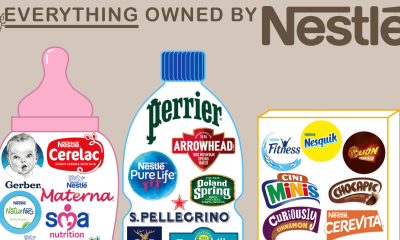

Nestlé is estimated to own over 2,000 brands in over 186 countries, making it the largest food company in the world. Some major brands that Nestlé...
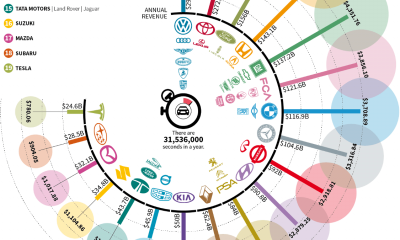

We know that major companies are making a fortune on a daily basis, but how much are they really making when you break it down to...
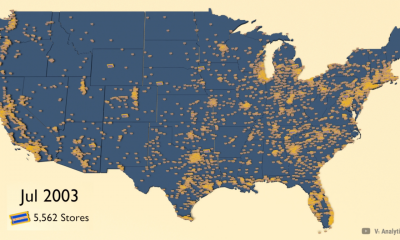

The rise of major streaming services such as Netflix and online retailers such as Amazon have had a devastating impact on once-booming American classic retail establishments...
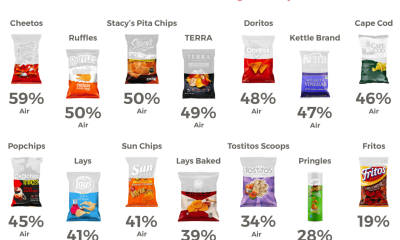

When shopping, there’s actually quite a bit of misleading packaging out there that you need to be careful of. When it comes to snacks, you’ve surely...