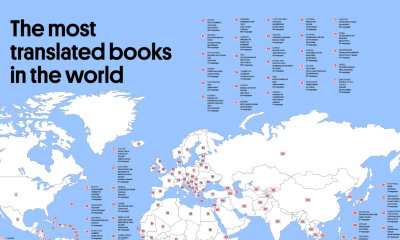
Wide translation is a hallmark of a book and an author’s success and influence, indicating high readership and a place...


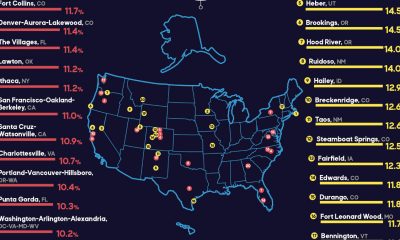

The COVID-19 pandemic changed everything, and working from home proved to be something that many workers preferred! From the team at Financial Force comes this study...


Most people know Warren Buffett for being one of the most famous billionaires in the world. However, some may not know that he is the Chairman...
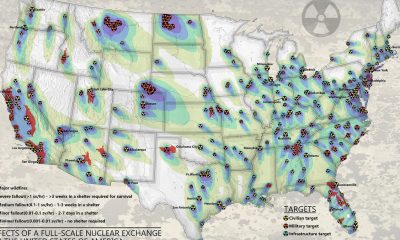

With the ongoing war between Ukraine and Russia, many people have begun to wonder, and worry, if nuclear weapons will eventually come into play. As of...
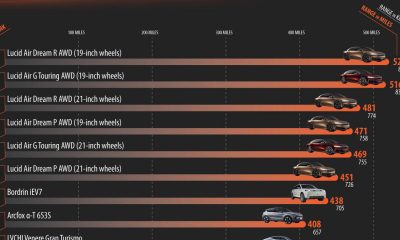

I’m sure you have seen more and more electric cars driving around your city and more and more EV charging stations popping up around town. The...
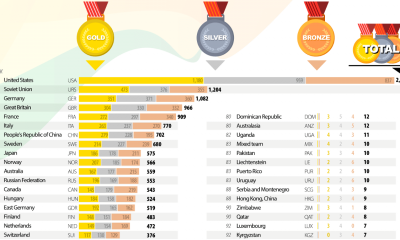

The road to the Olympic Games is a long grind that brings together only the top athletes of the world. To qualify, athletes are selected by...
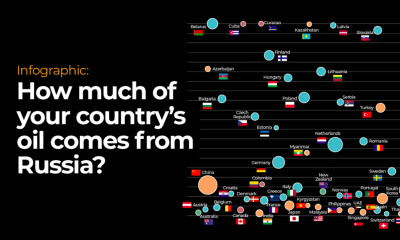

Oil prices have been surging to unprecedented heights across the United States since Russia invaded Ukraine on February 24th. Russia is the world’s largest exporter of...
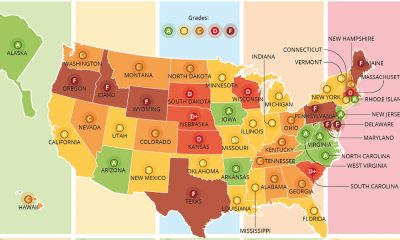

If you are in your twenties or older, you probably look back to your elementary school days and remember recess fondly. Sadly, over the years some...
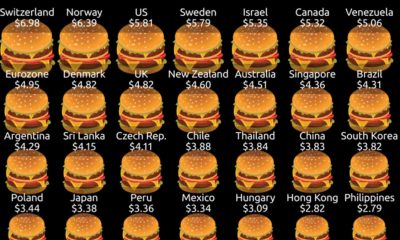

The iconic Big Mac is a two-beef patty, three bun delicacy topped with iceberg lettuce, American cheese, pickles, chopped onions and the super secret Mac Sauce....
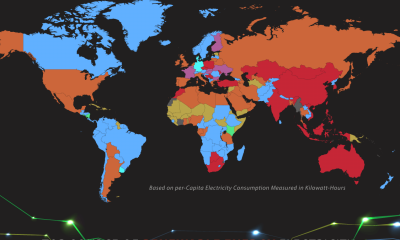

Around the world, which sources of electricity are the most popular? Some countries rely on traditional sources of energy like oil, gas or coal, while other...
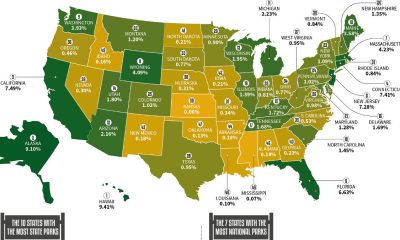

You might be surprised that the states with the most land don’t necessarily have the most national parks or state parks. This interactive map and visualization...