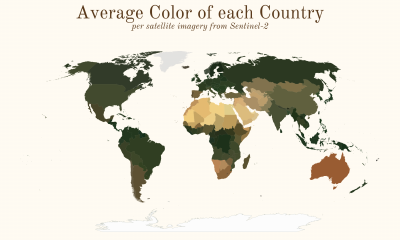

When you think about countries with an abundance of desert like Egypt, you generally think of yellow and orange sand colors. Likewise, countries with rainforests like...
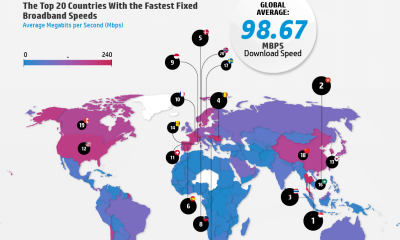

Singapore is home to the fastest average internet speed in the world, where the average download speed is an incredible 238.59 megabits per second. There are...
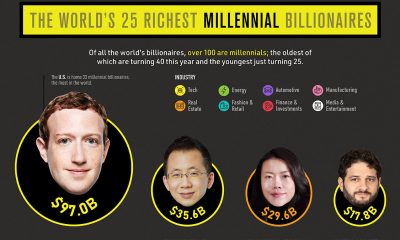

There are around 2,755 billionaires currently on planet Earth (although we could temporarily subtract one while Jeff Bezos’ rocket was in “space”). These billionaires have an...
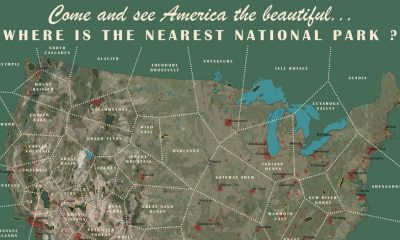

If you’ve ever wondered which of the sixty-three National Parks that are scattered throughout the United States is closest to you, then wonder no more! We...
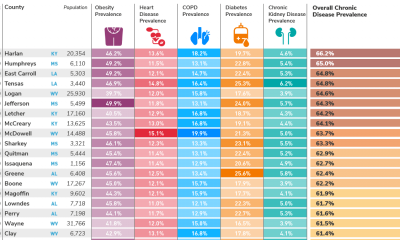

A chronic disease is a condition that can last for a year or more and calls for ongoing medical attention. Examples of chronic diseases and illnesses...
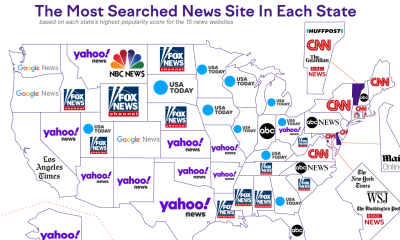

Fake news has become a hot-button issue in recent years, with many questioning where they and others are getting their news from. So, where is everyone...
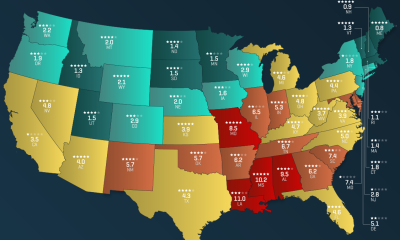

Guns have always been a topic of contention in America. Pro-gun roups constantly clash with gun-control advocates over second amendment rights. It is often at the...

In many ways, the Internet has become an absolute necessity in our daily lives. For many over the past year, working from home has simply become...
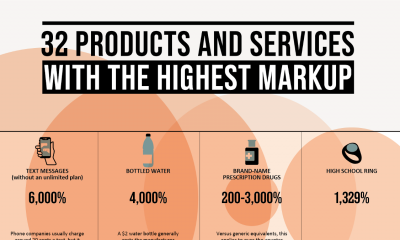

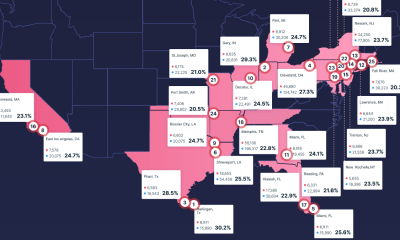
Society has been trained not to blink an eye when paying two bucks for a bottle of water, or shelling out ten dollars for a bucket...
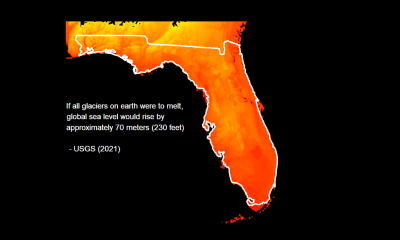

Did you know that the sea level is rising in Florida, and that it’s costing over $4 billion? In the present day, the sea level surrounding...